Figure 3.
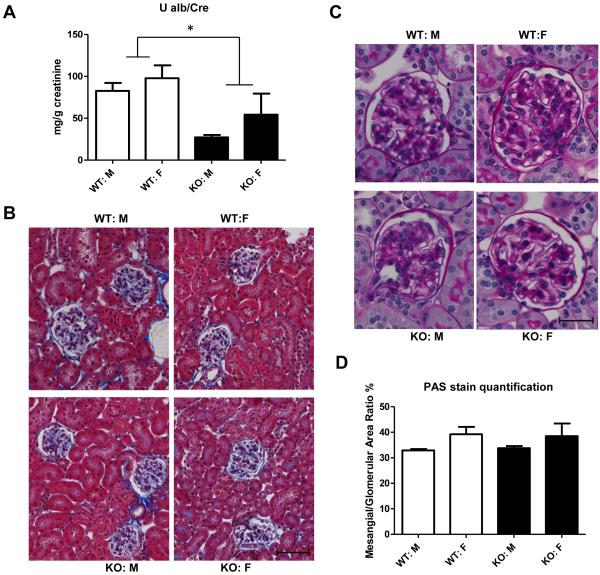
Effect of BGN deficiency on kidney function and structure in mice. A: Urinary albumin excretion is expressed as mg albumin per g creatinine, and was measured in 24 h urine samples obtained from individual mice. Shown is mean±SEM from N = 5-12/group. *p<0.05; WT Vs KO. B: representative light micrographs of Masson’s Trichrome stain from kidney sections. Scale bar: 20 μm. Original magnification: X200. C: Mesangial matrix was evaluated on renal sections stained with periodic acid Schiff (PAS). Shown are representative sections from 4 groups. Scale bar: 10 μm. Original magnification: X400. C: Mesangial matrix accumulation was quantified using ImageJ software.

