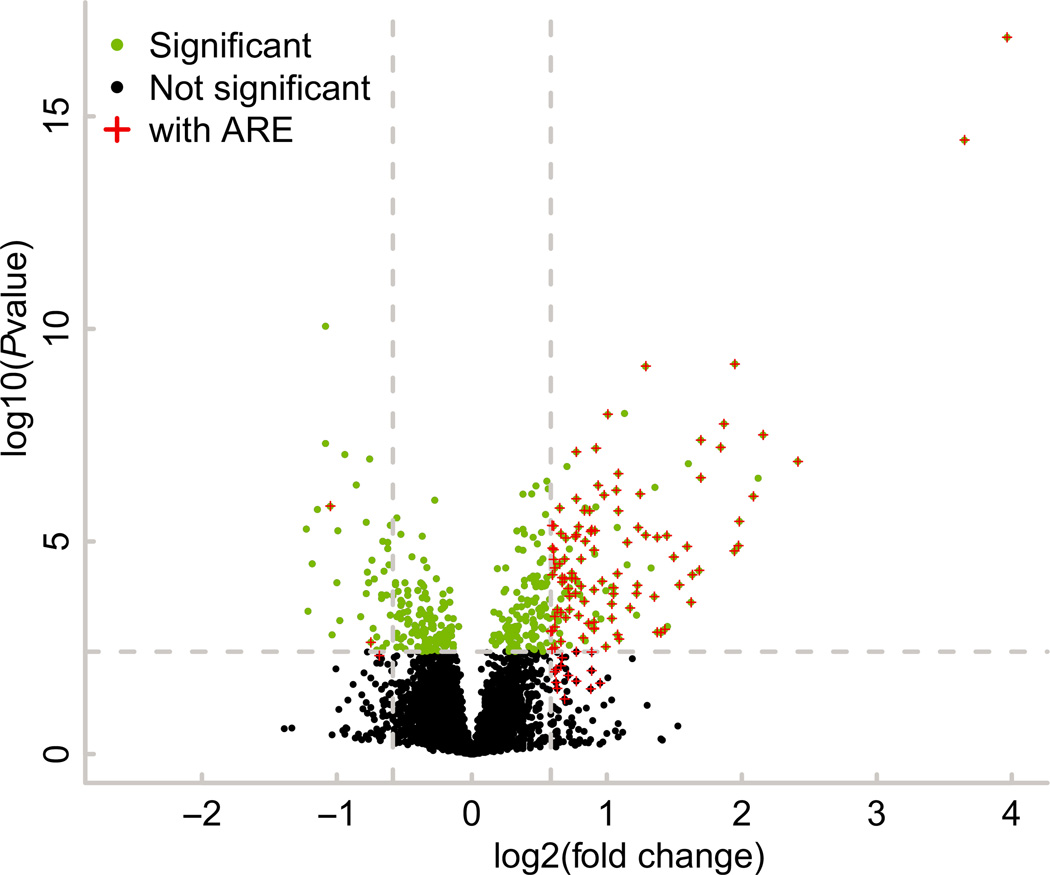
Fig. 2.
Up- and down-regulated transcripts that contain at least one potential TTP family member binding site. Shown is a volcano plot for transcripts identified by mRNA-Seq with a raw read count of at least 100. Green dots represent transcripts with a multiple-test adjusted P value ≤ 0.05; this level is also indicated by the horizontal dashed line. Up-and down-regulated transcripts that were changed by at least 1.5-fold are to the right and left of the vertical dashed lines respectively. Transcripts that contain at least a single 7-mer binding site in their 3′UTR are indicated with a red plus (+).

