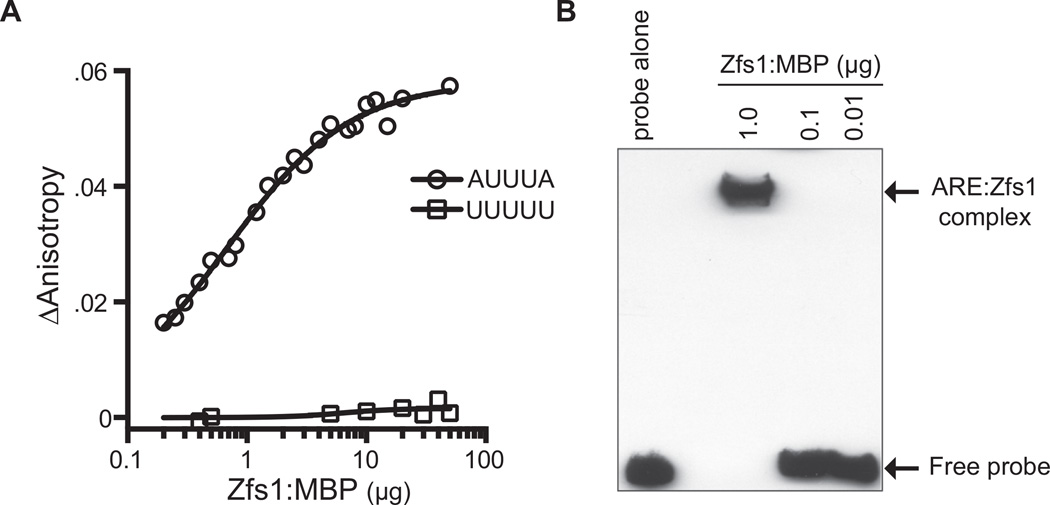
Fig. 7. Measurement of Zfs1 RNA binding affinity using fluorescence anisotropy.
A. Binding reactions containing the 13 base fluorescein-labeled RNA target (5′-FL-UUUUAUUUAUUUU-3′; FL-ARE13), or the control polyU probe (5′-FL-UUUUUUUUUUUUU-3′), and a titration of purified Zfs1:MBP were mixed and fluorescence intensity was monitored. A nonlinear regression algorithm in PRISM was used to calculate Zfs1-dependent changes in anisotropy. ΔAnistropy was calculated as anisotropy for probe alone subtracted from total anisotropy measured at each protein concentration.
B. Increasing concentrations of purified Zfs1:MBP or no protein (probe alone) were used in a gel shift analysis with a 5′biotin labeled TNF-ARE probe. Arrows to the right indicate migration positions of the ARE probe and the Zfs1:MBP ARE probe complex.

