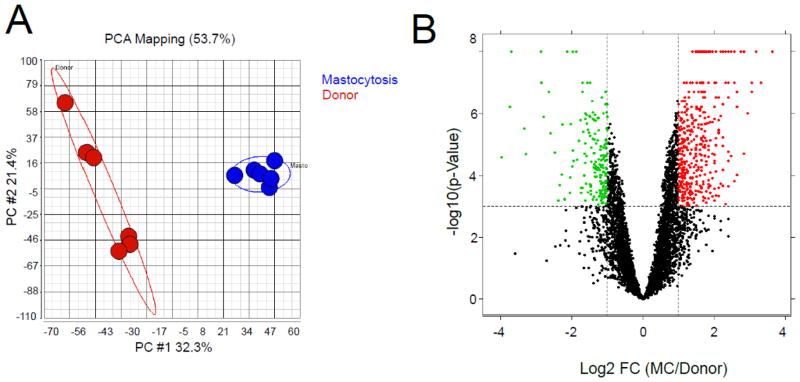
Fig. 5. Gene expression profiling on BMSCs from mastocytosis patients and healthy donors.
Gene expression profiling was performed on BMSCs from 3 age-matched MS patients and donors. A. The genes that were detected by more than 1.5-fold change in at least 1 sample were used to run the Principle Component Analysis (PCA) [24]. The BMSCs from patients (blue spheres) were separated from those from normal donors (red spheres). B. The differentially expressed genes were identified by using a t-test, and 410 genes were up-regulated in BMSCs from MC patients (red dots, fold change >=2), while 185 were down-regulated (green dots, fold change >=2), x-axis indicates the log2 fold change of mastocytosis/donor, y-axis indicates the −log10 (p-value).

