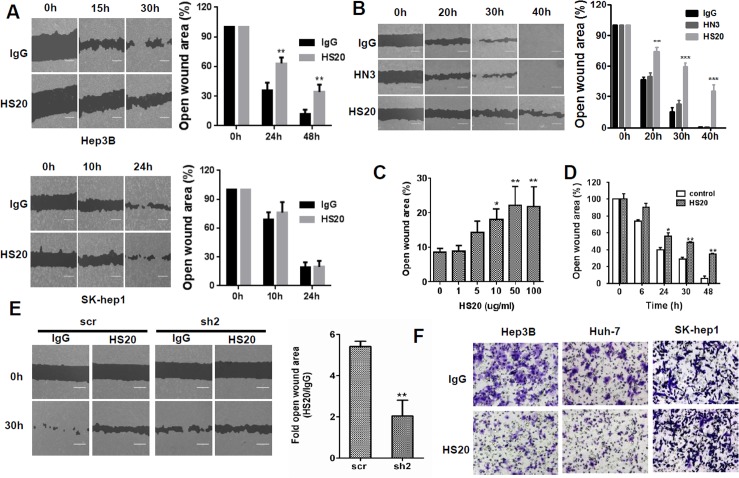
Fig 2. Blocking the HS chains of GPC3 by HS20 inhibited cell migration and motility in HCC cells.
(A) Hep3B cells and SK-hep1 cells were treated with 50 μg/mL IgG or HS20. Cell migration ability was then measured in a wound healing assay. Scale bar indicates 400 μm. The open wound area at 0 hours was regarded as 100%. Values represent mean ± SD from three replicates. P**<0.01 compare to IgG group. (B) Hep3B cells were treated with 50 μg/mL of the indicated antibodies. Cell migration ability was then measured in a wound healing assay. Scale bar indicates 400 μm. HN3: an antibody specific for the core protein of GPC3. The open wound area at 0 hours was regarded as 100%. Values represent mean ± SD from three replicates. P**<0.01 and P***<0.001 compared to IgG group. (C) Wound healing assay to measure cell migration ability on Hep3B cells treated with different concentrations of HS20 for 24 hours. The open wound area at 0 hours of HS20 treatment was regarded as 100%. Values represent mean ± SD from three replicates. P*<0.05 and P**<0.01. (D) Time course of wound healing assays on Hep3B cells treated with 50 μg/mL HS20. The open wound area at 0 hours of HS20 treatment was regarded as 100%. Values represent mean ± SD from three replicates. P*<0.05 and P**<0.01. (E) Hep3B scr cells and Hep3B GPC3-knockdown cells (sh-2) were treated with 100 μg/mL HS20 or human IgG, and then the wound healing assay was performed. In each group, the open wound area of HS20 treatment was compared to that of IgG treatment and is shown as the fold of the open area. Scale bar indicates 400 μm. Values are mean ± SD from three replicates. P**<0.01. (F) Trans-well assay to examine cell motility in Hep3B, Huh-7, and SK-hep1 cells pre-treated with 50 μg/mL IgG or HS20. Scale bar indicates 50 μm.

