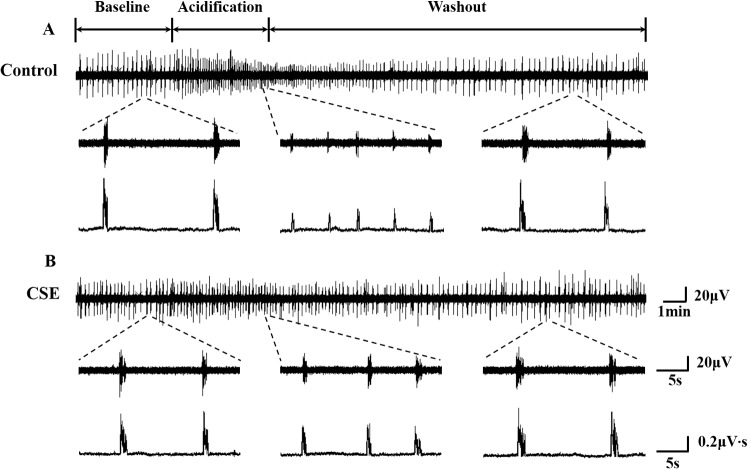
Fig 1. Recordings of hypoglossal rootlets discharge in medullary slices.
Typical recording of the discharge from the control group (A) and the CSE group (B), respectively. In each panel, the upper line indicates the compression format of activities of the hypoglossal rootlets throughout the experiment, and the middle and lower lines indicate the raw and integrated activities of the hypoglossal rootlets before, during and after acidification, respectively.

