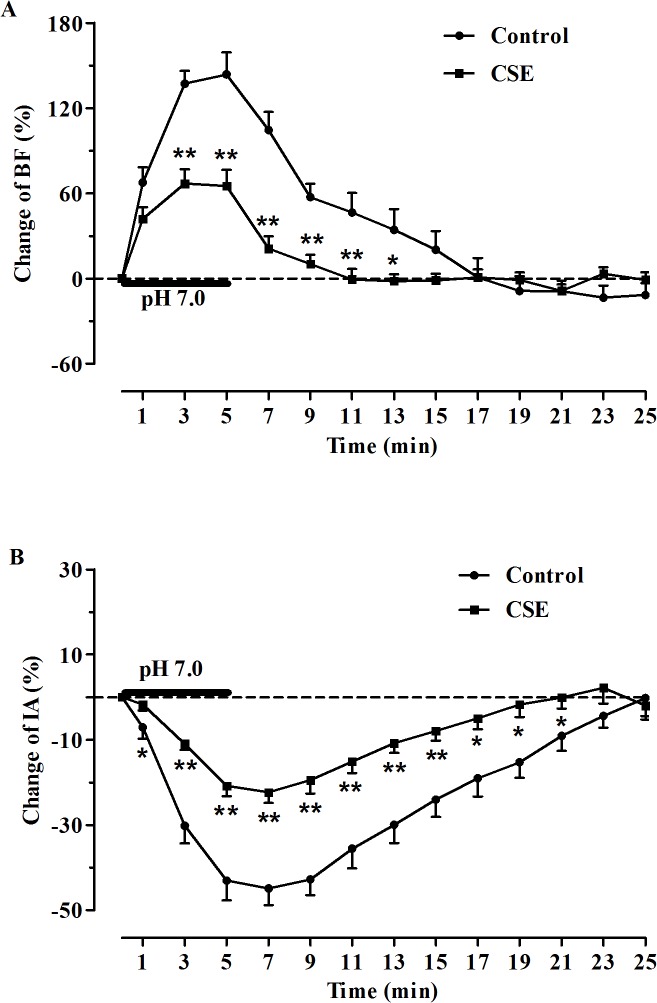
Fig 4. Comparison of changes in hypoglossal rootlets discharge in medullary slices induced by acidification.
(A) Comparison of burst frequency (BF) of hypoglossal rootlets between the control (n = 13) and CSE (n = 15) groups; (B) Comparison of integrated amplitude (IA) of hypoglossal rootlets between the control (n = 13) and CSE (n = 15) groups. *P< 0.05, **P< 0.01 vs. CSE.

