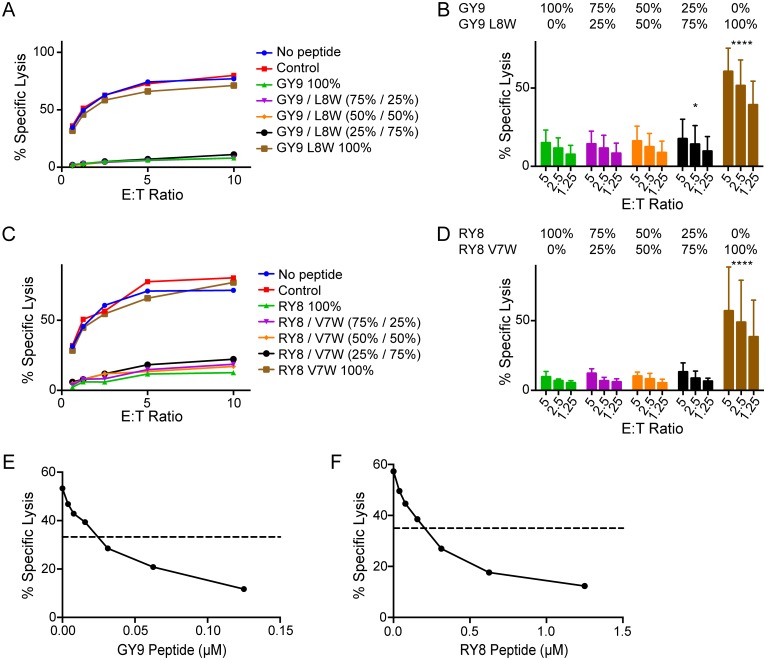
Fig 6. Signals from inhibitory peptides dominate to suppress NK cell activation.
721.221-ICP47-A1*002 cells were pulsed with mixtures of Gag GY9 and GY9 L8W (A, B & E) or Env RY8 and RY8 V7W (C, D & F) and tested for susceptibility to killing by Mamu-KIR3DL05+ NK cells in CAM cytotoxicity assays. Representative data (A & C) and mean percent specific lysis (B & D) are shown for three independent experiments using NK cells from different animals. In panels A-D, the percentages of inhibitory versus disinhibitory peptides varied, keeping the total peptide concentration constant at 0.5 μM for GY9/GY9 L8W and 5 μM for RY8/RY8 V7W. Error bars indicate +1 SD and asterisks indicate significant differences in the lysis of target cells pulsed with GY9 or RY8 compared to target cells pulsed with the indicated peptide mixtures (*p<0.05, ****p<0.001 by two-way ANOVA with Dunnett’s test). In panels E-F, target cells were pulsed with increasing concentrations of Gag GY9 (E) or Env RY8 (F) in combination with a fixed concentration of their respective disinhibitory variants (0.375 μM GY9 L8W or 3.75 μM RY8 V7W). The dashed line indicates 50% inhibition where GY9 or RY8 alone defines 100% inhibition and GY9 L8W or RY8 V7W alone defines 0% inhibition. Mamu-A1*002 stabilization on the surface of 721.221-ICP47-A1*002 cells was verified by flow cytometry using the MHC class I-specific monoclonal antibody W6/32 (S5 Fig).

