
Fig 2. Longitudinal analysis of circulating Tfh1-, Tfh2-, Tfh17-like subsets and their PD1 and ICOS expression.
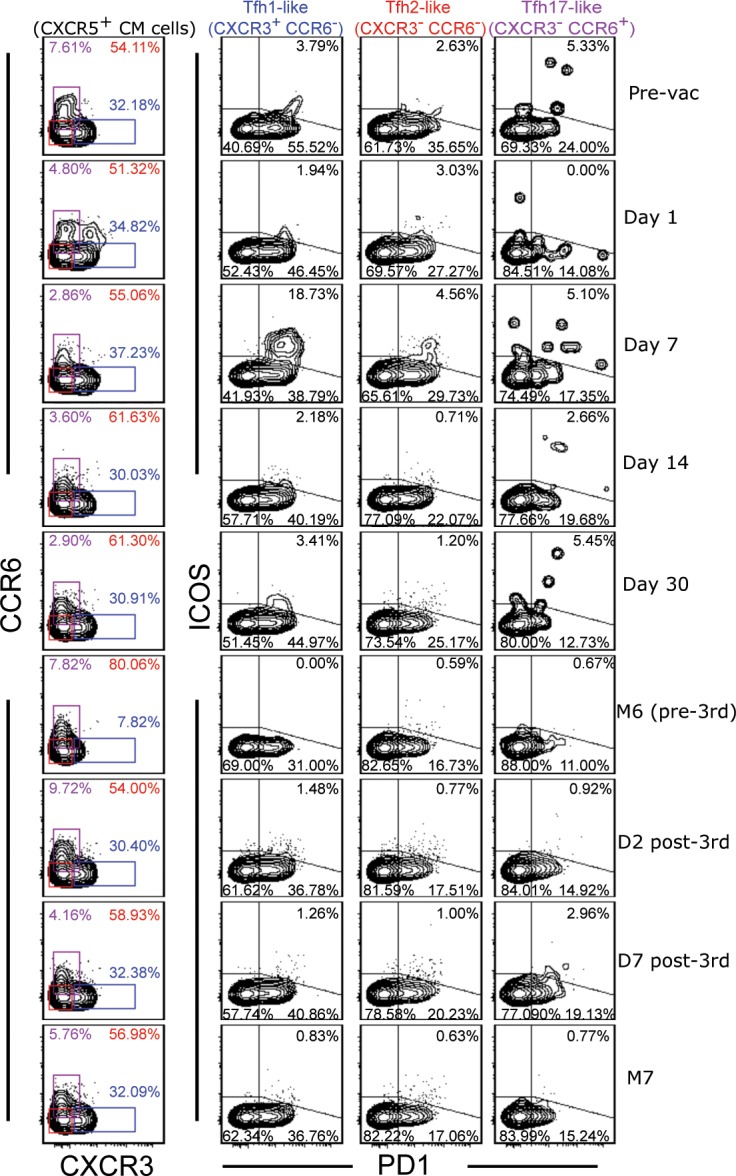
One of the HPV vaccine samples (Gardasil) is shown. The contour plots on the left most column show the expression of CXCR3 and CCR6 on CXCR5+ CM cells in samples collected from the indicated time points that are shown on the right. These two markers were used to identify Tfh1-like (blue), Tfh2-like (red), and Tfh17-like (purple) subsets. The percentages of each of these subsets are shown inside the plots. The second, third, and fourth columns of plots show the expression of PD1 and ICOS in each of the Tfh-like subset. In the upper right quadrants, the percentages of PD1+ ICOS+ Tfh-like cells are shown. The percentages of PD1+ ICOS- and double negative cells are indicated in the lower right and lower left quadrants, respectively.