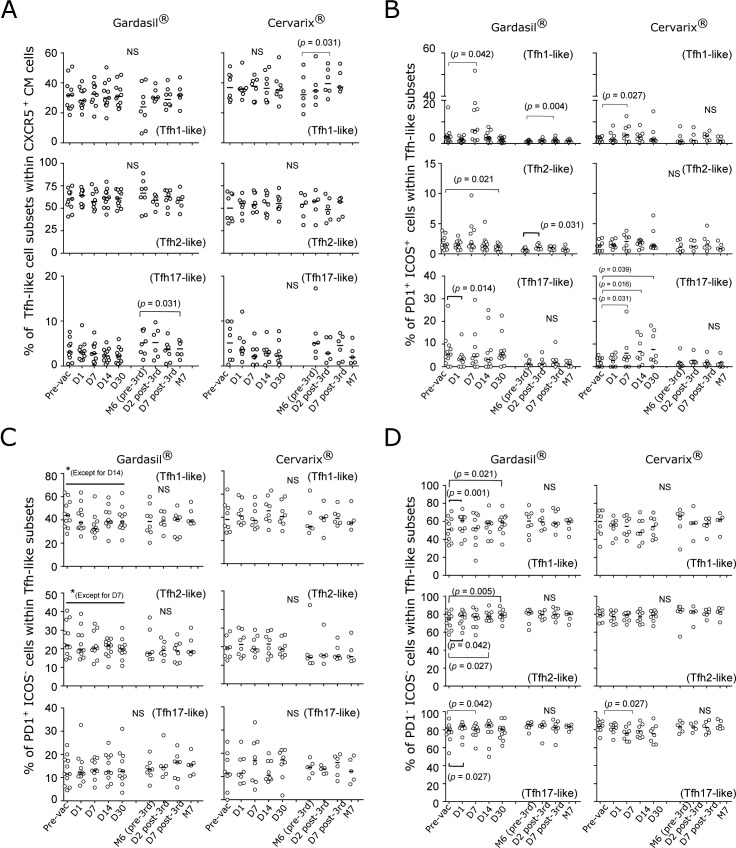
Fig 3. Frequency distributions of different subsets of circulating Tfh-like cells.
(A) Percentages of circulating Tfh1-, Tfh2-, and Tfh17-like subsets from the Gardasil and Cervarix groups are shown. (B) Frequencies of PD1/ICOS double positive cells, (C) frequencies of PD1+ ICOS- cells, and (D) frequencies of double negative cells within each subset were plotted over time. N = 10–11 (pre-vac to D30) and N = 6–8 (M6 to M7) for Gardasil. N = 8 (pre-vac to D30) and N = 5–6 (M6 to M7) for Cervarix. Paired, one-tailed Wilcoxon rank sum analyses were performed between the pre-vac time point and each of the post-vaccination time point for the first vaccination. For the third vaccination (M6 to M7), M6 was used as the baseline for the analyses. Black horizontal bars indicate the medians. For the comparison of the two vaccine groups described in the “HPV vaccines induced circulating PD1+ICOS+ Tfh1-like cells” section, paired, two-tailed Wilcoxon rank sum analyses were performed.

