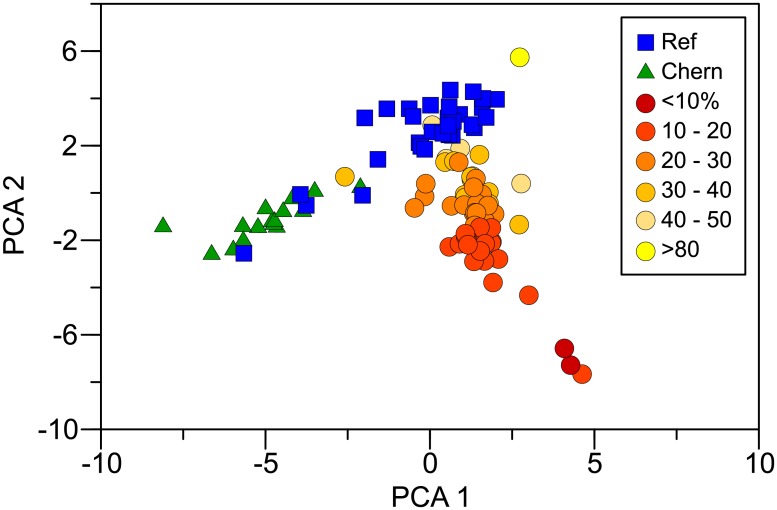
Fig 6. First and second principal components (PCA 1 and PCA 2) from the correlation matrix of normalized PAHs in mussel tissue.
Oiled sites are illustrated with circles, reference with squares (blue), and Chernofski Harbor with triangles (green). Oiled results are color coded by percent naphthalenes, a measure of weathering. The most weathered samples have the least naphthalene.

