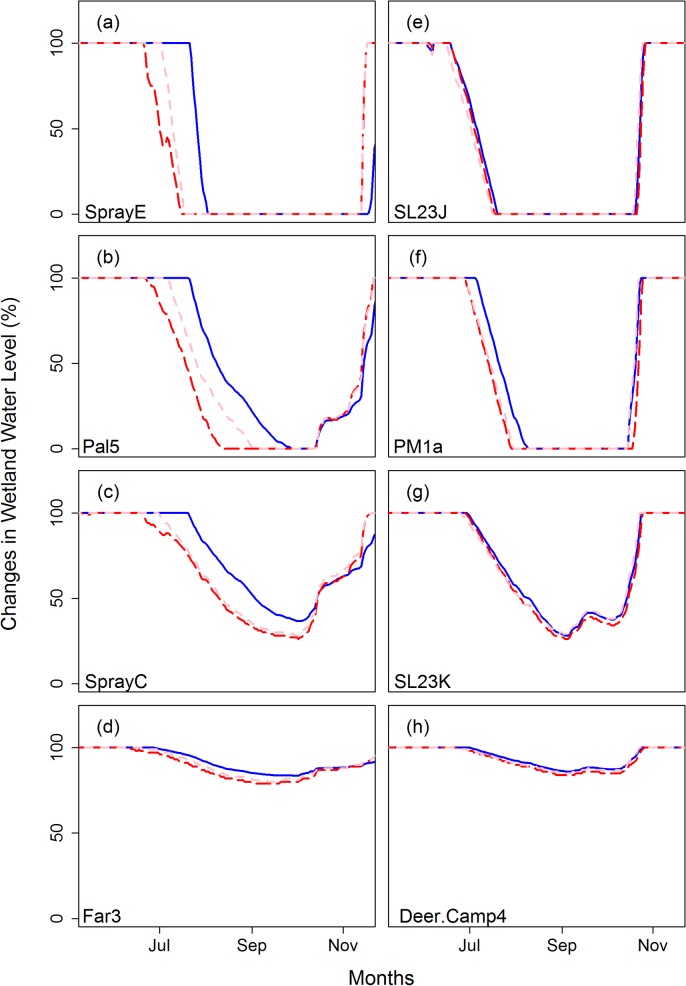
Fig 8. Projected wetland response to climate change for sites in Mt. Rainier National Park, WA (a-d) and in Olympic National Park, WA (e-h) for ephemeral hydroperiod (a,e), intermediate hydroperiod (b,f), perennial (c,g) and permanent wetlands (d,h).
Blue solid lines are wetland hydrographs for representative years 1998 (a-d) and 1985 (e-h) and pink and read dashed lines show wetland hydrographs of year 1998 (a-d) and 1985 (e-h) with climate change perturbation for the 2040s and 2080s, respectively.

