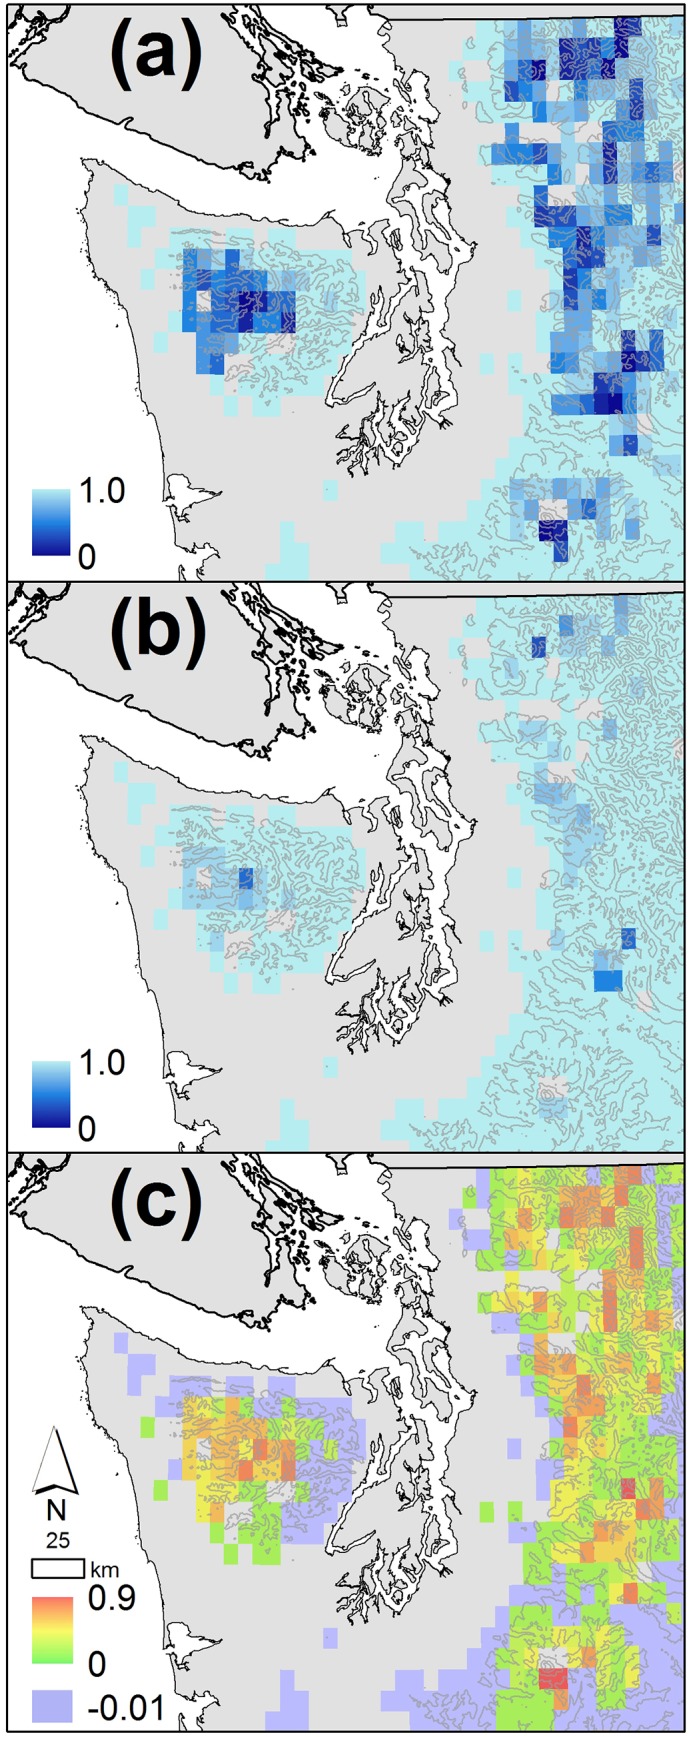
Fig 10. Map of the difference between historical probability of drying and that of the 2080s for intermediate wetlands in the mountains of Western Washington state.

Projections for the 2080s are the average value for all ten GCM A1B scenarios. Colored grid cells are above 250m elevation, the region in which our projections are most relevant. Topographic contour intervals are 750m.
