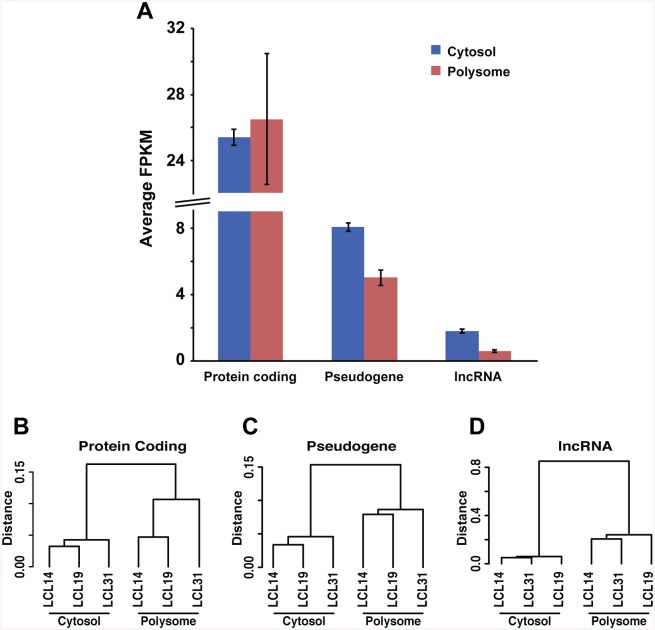
Fig 3. RNA classes in cytosol and polysomes from three LCLs, measured by RNA-Seq.
After amplification of total cytosol RNA fraction and polysome fractions with NuGen, equal amounts of RNA were subjected to RNA-Seq, and sequence reads were aligned to annotated RNA to determine expression levels. A. Average expression level (normalized to FKPM) in cytoplasmic and polysome fractions from 3 different LCLs after exclusion of rRNA, tRNA, and mt-RNA. The pseudogenes and lncRNAs are reduced on polysome fractions. In cytosol lncRNA represent antisense-RNA (21.3%), lincRNA (4.7%) and lncRNA (74%). On polysomes the lncRNA distribution was drastically different: antisense-RNA (73%), lincRNA (14%) and lncRNA (13%). Error bars represent expression s.d. from 3 different LCL cells. B-D. Hierarchical clustering of the profiles of protein coding genes (B), pseudogenes (C) and lncRNA (D) performed with similarity indices (see Materials and Methods) for cytosol and polysome fractions. Observed difference of similarity indices between cytosol and polysome clusters is higher in lncRNA than in other RNA classes (note the difference on vertical scale).

