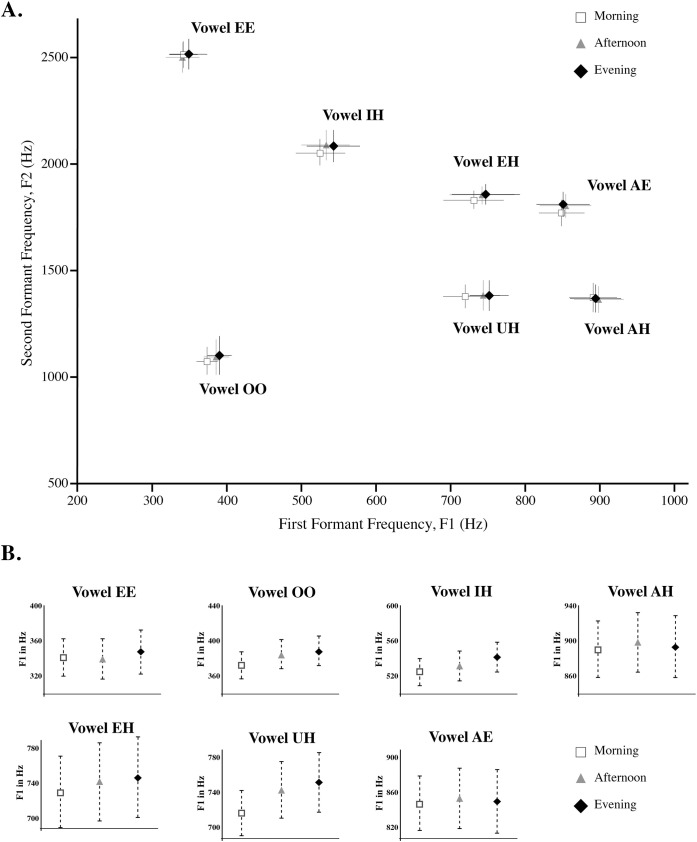
Fig 1. A. Mean F1 value by Mean F2 value plot at three different times (Morning, Afternoon and Evening) for each vowel tested across subjects.
Error bars denote 1 standard error. B. Mean F1 values at three different times (Morning, Afternoon, and Evening) for each vowel tested across subjects. Error bars denote 1 standard error. As indicated by an average standard error of 27.60 Hz over the course day, there is high precision in isolated citation-form vowel production.

