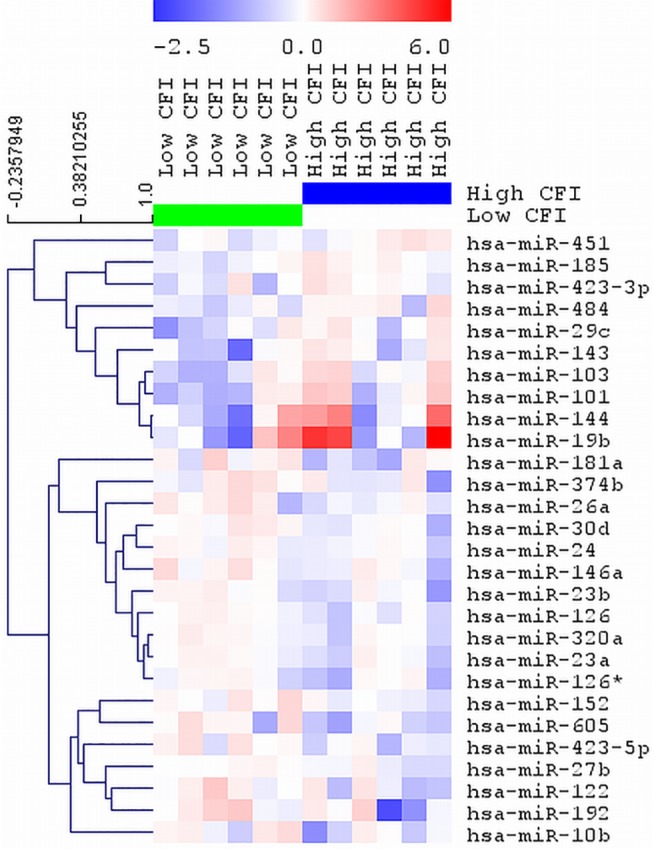
Fig 2. Differential microRNA expression in patients with high versus low CFI.

Heat map and supervised hierarchical clustering of the top 28 microRNAs with the lowest p-value across all samples. Each row represents one microRNA and each column represents one sample. Each sample consists of pooled plasma samples from 3 patients with either high CFI or low CFI, resulting in a total of 12 samples. The color scale shows the relative expression level of a microRNA across samples, where red color depicts an expression level above mean and blue color represents down regulated expression. CFI: collateral flow index.
