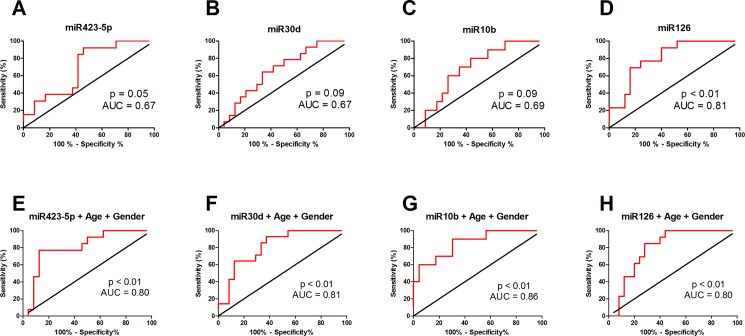
Fig 4. Diagnostic potential of miRNAs.
Receiver operator characteristic curve analysis of individual miRNAs (A: miR423-5p; B: miR30d; C: miR10b; D: miR126) and multivariate logistic regression models of individual microRNAs together with age and gender (E: miR423-5p; F: miR30d; G: miR10b; H: miR126) to discriminate between high or low collateral capacity patients. Red line depicts sensitivity (%) as a function of 1- specificity (%). The black line depicts the identity line. The greater the area between the ROC curve (red) and identity line (black), the more accurate the test and the larger the discriminatory power of the test. Multivariate logistic regression models with age and gender increase the area under the curve (AUC) of each miRNA, and thus improve their power to discriminate between patients with either high or low collateral capacity.

