
Figure 2. Haemocyte concentration change.
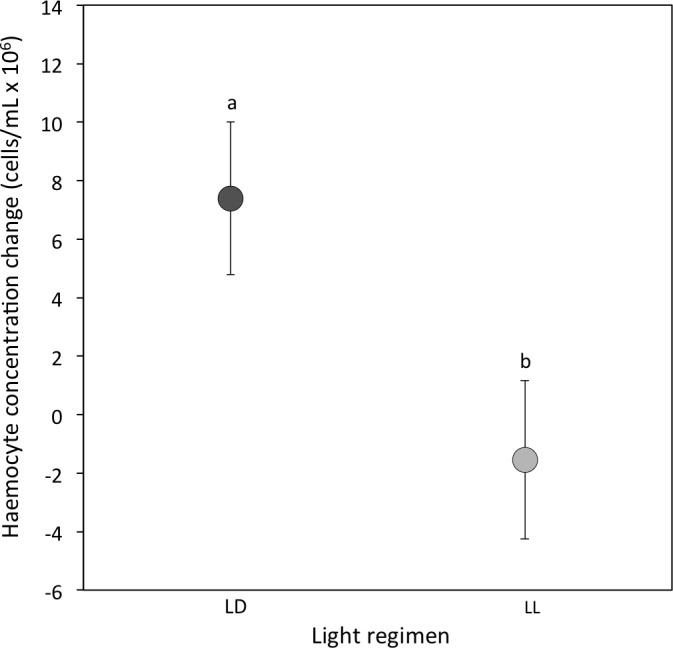
Mean change in haemocyte concentration (cells/ml × 106) from the 3-week to the 5-week sampling period for LD (dark grey) and LL (light grey) crickets (LD N = 53; LL N = 37). Error bars indicate standard errors (SE) about the mean; different letters indicate significant differences between groups (P < 0.05).