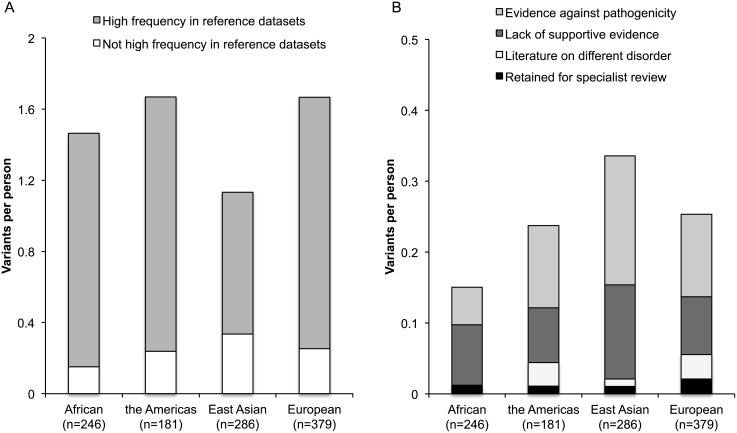
Fig 2. Results of literature screen of 237 filtered candidate variants.
These graphs compare the number of variants per person at different stages of the literature screen across the four major ancestry groups in the 1000 Genomes dataset. A) Compares the contribution of variants that were removed because of a high frequency in reference datasets to all of the other filtered variants. B) Compares the contribution to variants per person of all of the filtered variants that did not have a high frequency in reference datasets. Specifically, it compares the contribution of variants with evidence against a conclusion of pathogenicity, a lack of supportive evidence, literature on a different disorder, or those that were retained for specialist review.

