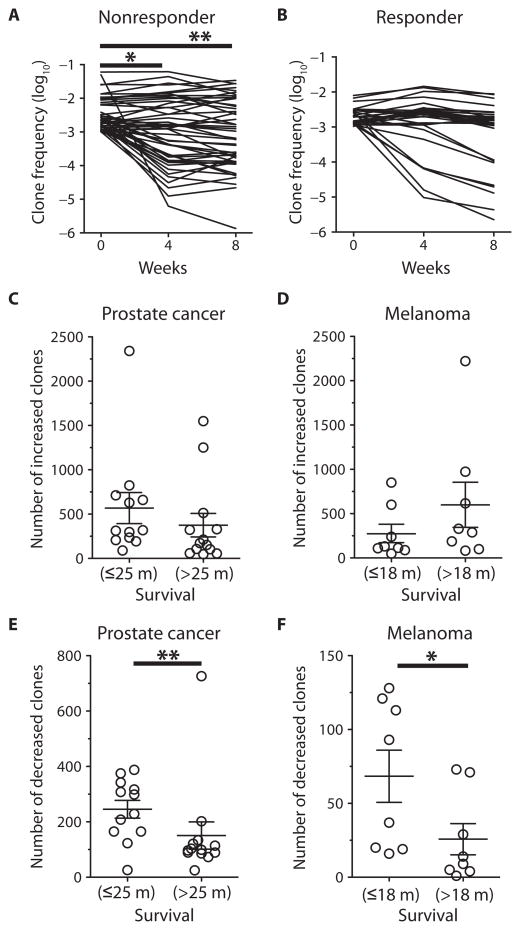
Fig. 3. Association between clonotype changes and clinical outcome.
(A and B) Representative clonotype frequencies that exist at ≥10−3 at baseline for a clinical nonresponder (A) and clinical responder (B) are presented over time. *P = 0.013; **P = 0.004, two-sided Mann-Whitney test. (C to F) The numbers of significantly increased clones were plotted for metastatic CRPC patients (C) and metastatic melanoma patients (D), and the numbers of significantly decreased clones for metastatic CRPC patients (E) and metastatic melanoma patients (F), with each cohort divided by median survival (m, months). Mean values with error bars as SEM are plotted. P values were calculated using a two-sided Mann-Whitney test: *P = 0.0281; **P = 0.006.

