
Figure 1. γH2AX immunohistochemistry results.
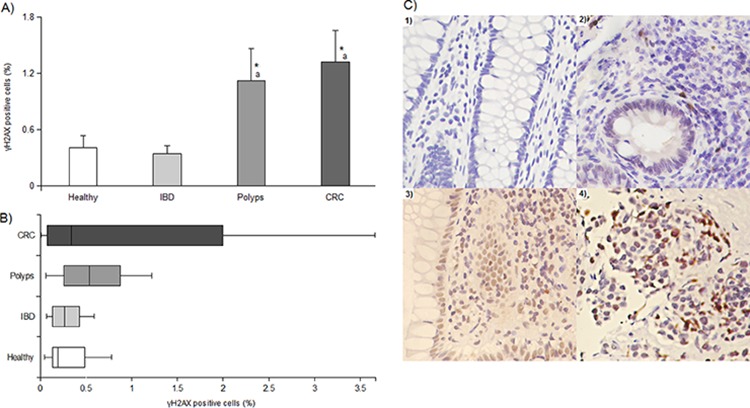
Panel A. average levels of γH2AX in the study population expressed as percentage of positive cells; * and a indicate a significant difference (P < 0.01) from healthy tissue and IBD samples, respectively. In each group, bars represent the mean ± SE. Panel B. box and whisker plot displaying data dispersion for γH2AX in each category. Panel C. photos of γH2AX expression in tissues from 1) healthy, 2) IBD, 3) polyp and 4) cancer biopsies. 200x magnification.