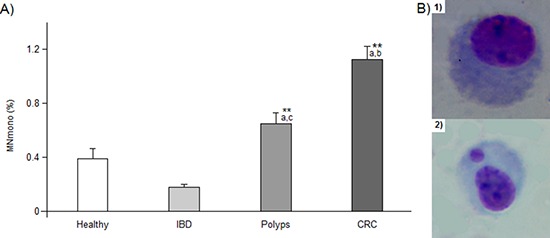
Figure 5. MNmono results.

Panel A. percentage of mononucleated lymphocytes bearing a micronucleus. ** or a, b and c indicate a significant difference (P < 0.001) from healthy subjects or from IBD, polyps and CRC patients, respectively. In each group, bars represent the mean ± SE Panel B: photos of lymphocytes (Giemsa staining), without micronucleus (1) and with a MN (2). 400x magnification.
