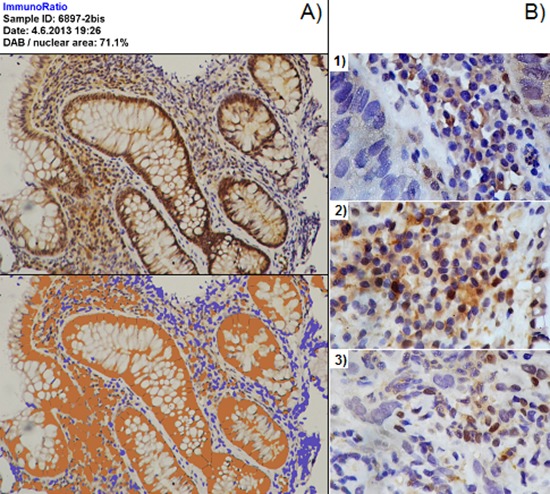
Figure 7. Image analysis for GSTO1 in tissue.

Panel A. use of ImmunoRatio for quantification of GSTO1 expression. The original image and the corresponding plug-in output, quantified as positive DAB area, are shown at the top and the bottom of the panel, respectively. 100x magnification. Panel B. quantification of GSTO1 localization through fields scoring; example of 1) cytoplasmic field (assigned score 0), 2) field with mixed localization (assigned score 0.5), and 3) field with prevalent nuclear localization (assigned score 1). 400x magnification.
