
Figure 6. Clinical correlations between TR and LCN2 and associated parameters in HCC.
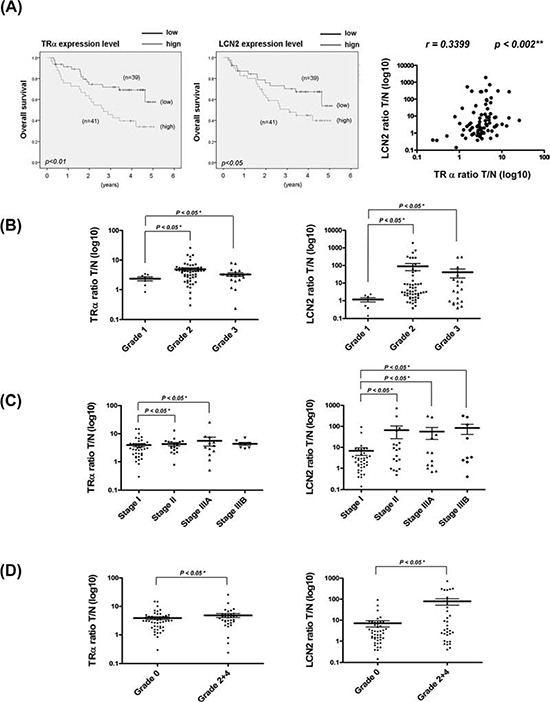
A. Expression of LCN2 and TR mRNA in 80 paired HCC specimens determined using q-RT-PCR. Overall survival rates of TR and LCN2 were analyzed with SPSS software. The blue line indicates low expression of TR and LCN2, and the green line represents high levels of TR (left) and LCN2 (right). Correlations of T/N ratios between TR and LCN2 (right panel) were analyzed using linear regression. In relation to B. tumor grade, C. TNM stage, and D. vascular invasion grade, the T/N ratios of TR and LCN2 showed similar patterns. Differences were analyzed using One-way ANOVA, *P < 0.05.