
Figure 3. Cancer-specific and overall survival after liver surgery in correlation with HER-3 expression.
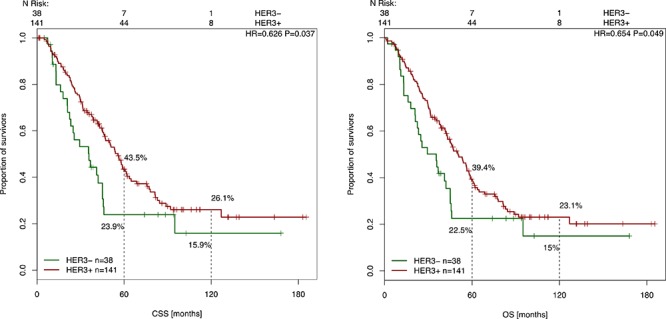
Kaplan-Meier curve for CSS and OS of CRC patients with high and low HER-3 expression levels (p = 0.037, p = 0.049). The Cox model for CSS and OS based on HER-3 status from 179 resection specimens of liver metastases.