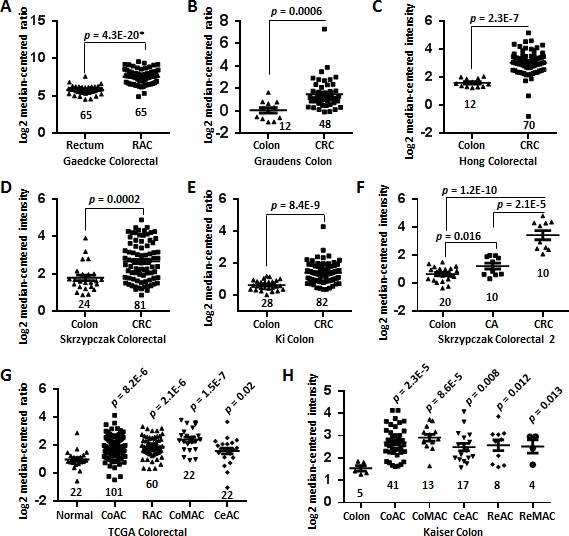
Figure 1. Upregulation of SPON2 mRNA in CRC revealed by data-mining of the Oncomine gene expression database.

A. Gene expression of SPON2 is upregulated in rectal adenocarcinoma (RAC) tissues comparing with the normal rectum tissues revealed using the Gaedcke Colorectal dataset from Oncomine database (https://www.oncomine.org/resource/login.html). B. Differential SPON2 gene expression in the normal colon and colorectal carcinoma (CRC) tissues revealed by the Graudens Colon dataset. C. SPON2 expression in the colon and CRC specimens in the Hong Colorectal dataset. D. SPON2 expression analysis in the colon and CRC tissues in the Skrzypczak Colorectal dataset. E. SPON2 expression in the normal colons and CRCs in the Ki Colon dataset. F. SPON2 expression in the colon, colon adenoma (CA) and CRC tissues in the Skrzypczak Colorectal 2 dataset. G. SPON2 expression in the normal tissues (colon or rectum), colon adenocarcinoma (CoAC), RAC, colon mucinous adenocarcinoma (CoMAC), cecum adenocarcinoma (CeAC) and CRC tissues in the TCGA colorectal dataset. H. SPON2 expression in the colon, CoAC, CoMAC, CeAC, rectosigmoid adenocarcinoma (ReAC), rectal mucinous adenocarcinoma (ReMAC) tissues in the Kaiser Colon dataset. The total number of cases were shown under each categories. The p values were calculated using two-tailed and unpaired Student's t test. The p value indicated with an asterisk was calculated using paired Student's t test.
