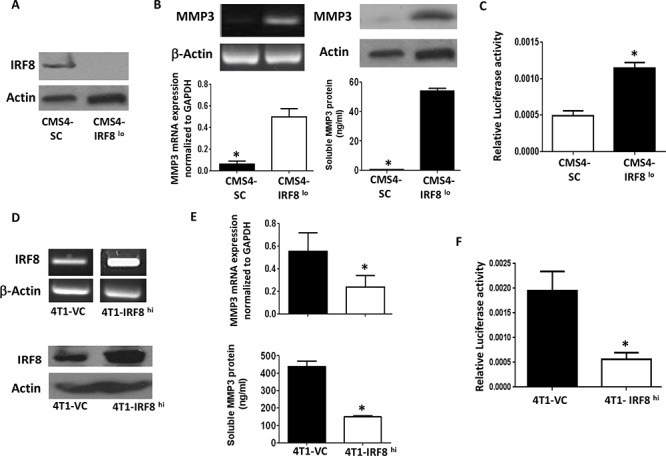
Figure 1. Inverse causal relationship between IRF8 and MMP3 expression.

A. Knockdown of IRF8 expression in the parental CMS4 cell model; scrambled control (SC) vs. CMS4-IRF8lo cells, as shown by Western blot. B. MMP3 mRNA levels (RT-PCR, upper left; qPCR) or MMP3 protein levels (Western blot, upper right; ELISA, lower right) measured in the same populations as in A. C. Relative MMP3 promoter activity in vector control vs. CMS4-IRF8lo cells, as measured by dual luciferase assay. D. IRF8 expression in 4T1 cells after transfection with an expression plasmid encoding the murine IRF8 gene or an empty vector control (VC). RT-PCR (upper panel) or Western blot (lower panel). E. Effect of enforced IRF8 expression on MMP3 levels as measured by qPCR (upper panel) or ELISA (lower panel). F. Relative MMP3 promoter activity in VC vs. 4T1-IRF8hi cells, as in C.
