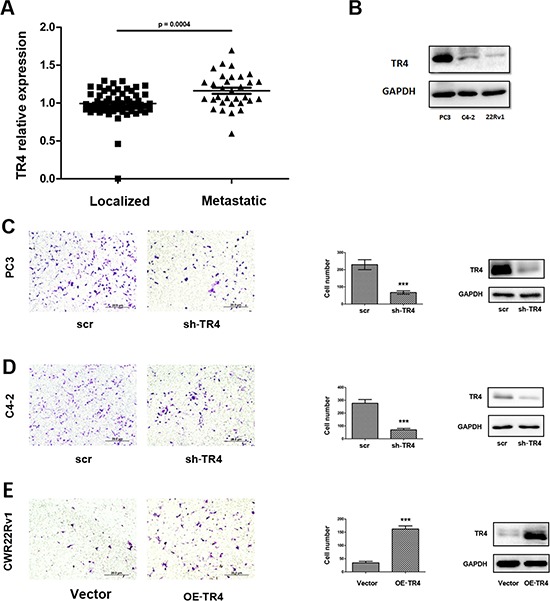
Figure 1. Effect of TR4 on PCa cell invasion.

A. GEO databases to analyze the PCa sample array with TR4 expression revealed that PCa tissues (n = 32). B. The different expression of TR4 in three PCa cell lines. In PC3 cells, the expression is highest and in CWR22Rv1 (22Rv1) cells, it is the lowest. C–E. After 48 hrs lentivirus transfection, cell were sded in cell invasion chambers with the inner wells coated with Matrigel and incubated for 24–36 hrs. Left panels: Representative microphotographs of invaded cells (100 ×). Middle panels: Quantitive analysis (cell numbers were counted in six randomly chosen microscopic fields per membrane). ***p < 0.001 Right panels: Western blot analysis for the knockdown or overexpression of TR4. C–D. Invasion assays were performed in C4–2 (C) or PC3 (D) cells transfected with sh-TR4 or scramble control. E. Invasion assays were performed in CWR22Rv1 cells transfected with overexpressed TR4 (OE-TR4) and vector control.
