
Figure 5. SR141716 stimulates MICA and MICB transcription and cell surface expression on responsive CB1 high primary cell lines enhancing NK-cell mediated cytotoxicity against glioma patient cells.
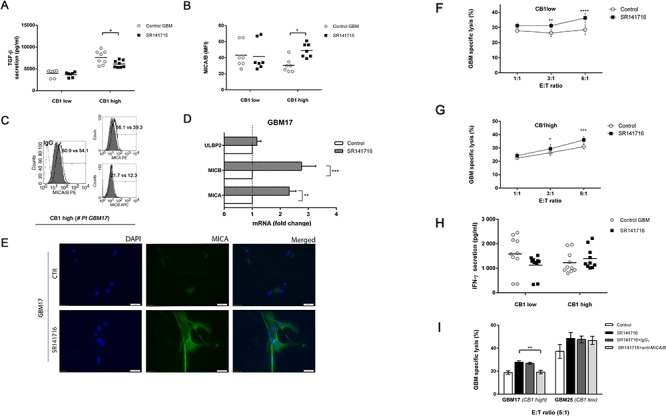
A. CB1 low (GBM22, GBM25, GBM27 CB1 low) and CB1 high (GMB17, GBM18, GBM24, GBM26) cell tumor primary cell lines were cultured for 24 h in the presence or absence of SR141716 20 μM before the determination of total TGF-β in cell culture supernatant by ELISA. Each dot represents the result from at least 2 different independent experiments for each indicated patient primary cell lines. B. MICA/B cell surface expression was analyzed by flow cytometry on CB1 low and CB1 high cells treated with SR141716 (20 μM) for 24 h. The mean fluorescence intensity (MFI) of MICA/B was calculated based on at least 2 different independent experiments for patient and evaluated by ANOVA (*P < 0.05, compared with untreated cells, control GBM). Each dot represents the result from at least 2 different independent experiments for each indicated patient primary cell lines. Bar graphs report mean values ± SD. C. Cell surface expression of total MICA/B or alternatively of MICA and MICB was analyzed by flow cytometry on one representative responsive patient's primary cell line (# GBM17) treated with SR141716 20 μM for 24 h. The gray-colored histograms represent basal expression of tot MICA/B, MICA or MICB whereas thick black-colored histograms represent the antigen expression after treatment with SR141716. D. Real-time PCR analysis of total mRNA obtained from GBM17 cells, unstimulated or treated with SR141716 20 μM for 6 h. MICA, MICB and ULBP2 mRNA expression was assessed. Data, expressed as fold change units, were normalized with GADPH and referred to the untreated cells considered as calibrator and represent the mean of 4 experiments (ANOVA, **P < 0.01, ***P < 0.001, compared with untreated cells, control). E. A representative patient's primary cell line (# GBM17) was cultured for 24 h in the presence or absence of SR141716 (20 μM). Subsequently, immunofluorescence analysis using the LEAF™ purified anti-human MICA/MICB (6D4) specific mAb followed by the secondary Alexa Fluor® 488-coniugate and DAPI for nuclear staining was performed. One representative experiment of a total of 3 is shown. Magnification, 20x. F-I. CB1 low F and CB1 high G cell groups were incubated for 18 h with or without SR141716 20 μM prior to 4 h flow cytometric assay of NK-cell cytotoxicity at the indicated effector to target ratios (E:T), as described in Materials and Methods. Afterwards, supernatants were harvested and analyzed for IFN-γ by ELISA. Each dot represents the result from at least 2 different independent experiments for each indicated patient primary cell lines H. To evaluate the role of MICA/B, as indicated in D, blocking anti-MICA/B (SR141716+anti-MICA/B) or isotype control F(ab')2 fragments (SR141716+IgG1) were added before addition of NK cells I. Results were expressed as the mean ± SD of 4 independent experiments conducted in triplicate. All pairwise comparisons are statistically significant (ANOVA; *P < 0.05, **P < 0.01, ***P < 0.001).