
Figure 7. Role of MAPKs in the response to MonoPt.
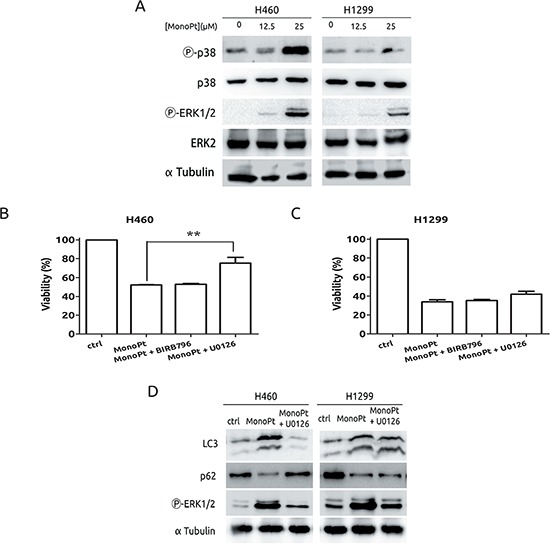
A. Cells were treated with the indicated concentrations of MonoPt for 8 h. Protein extracts were blotted with the indicated antibodies. B. and C. Cells were treated with 4.69 μM MonoPt either alone or in the presence of 10 μM BIRB796 or 10 μM U0126. Viability was measured by MTT. D. Cells were treated with 25 μM MonoPt in the presence or absence of 10 μM U0126 for 24 hours. Protein extracts were blotted with the indicated antibodies.