
Figure 1. Knocking down ENO1 expression suppressed glycolysis and cell proliferation in EC cells but not HEEC.
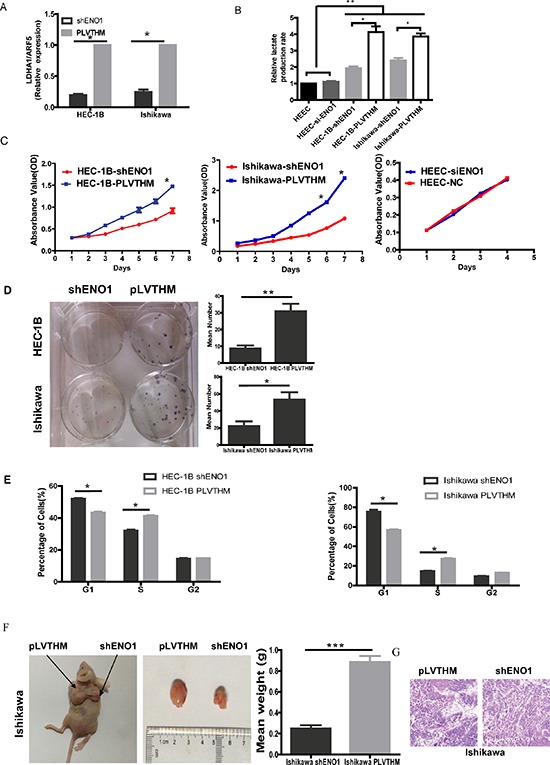
A. RT-PCR showing transcriptional level of the LDHA with ARF5 used as a loading control. Bar graph showed the relative expression of mRNA among the groups. Data were presented as mean ± SEM for three independent experiments (*P < 0.05). B. The levels of lactate production were examined in HEEC, EC cell lines and ENO1 sliencing EC cells using the Automatic Biochemical Analyzer (#7170A, HITACHI, Japan). Data were shown as mean ± SEM of three experiments(*P < 0.05, **P < 0.01). C. Effect of ENO1 knockdown on EC cells or HEEC cell proliferation as measured by MTT assay. Absorbance was read at 490 nm with averages shown from triplicate wells. Data were presented as mean ± SEM for three independent experiments (*P < 0.05). D. In vitro proliferative ability of EC cells was significantly decreased in ENO1-suppressed cells compared to PLVTHM cells by colony formation assay (*P < 0.05, **P < 0.01). E. ENO1-suppressed dramatically reduced cell cycle progression from G1 to S phase. Data were presented as mean ± SEM for three independent experiments (*P < 0.05). F. When compared with PLVTHM, in vivo tumorigenicity of shENO1-Ishikawa cells was markedly reduced (*P < 0.05). G. HE staining in subcutaneous tumors of mice injected with shENO1 or PLVTHM cells.