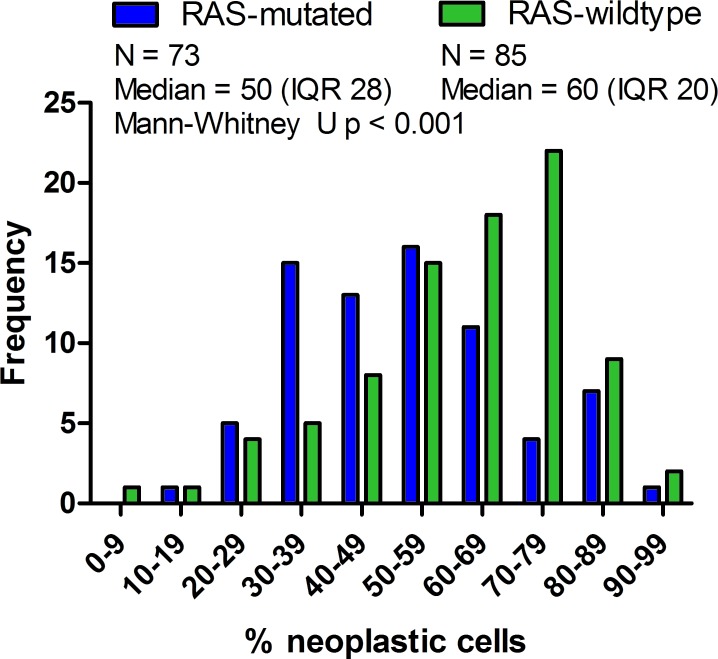
Figure 2. Neoplastic cell percentage in RAS-mutated and RAS-wild-type tumors.
The distribution of the estimated percentage of tumor cells in the test sample was compared between RAS-mutated and RAS-wild type CRC cases. Frequency of CRC cases is shown on the Y-axis; the X-axis represents the percentage of neoplastic cells. Mann-Whitney U test of the comparison indicates that the median neoplastic cell percentage of RAS-mutated mCRC cases is significantly lower (Median 50 (IQR 28), Mean Rank = 66,65) than RAS-wild-type mCRC cases (Median 60 (IQR 20), Mean Rank = 90,54; p = 0.001) and thus that the populations have distinct neoplastic cell percentage distributions.

