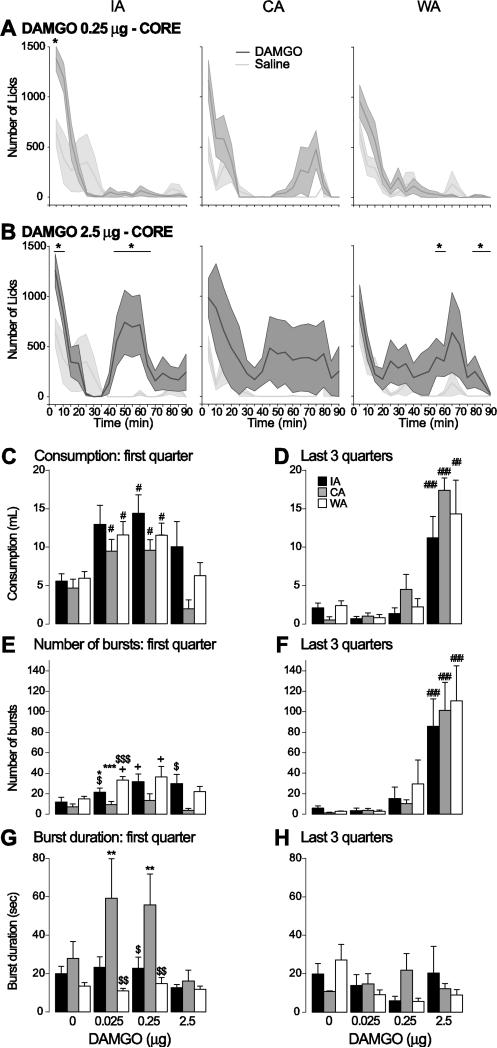
Figure 3. Effect of DAMGO injection in the core on COS consumption.
A,B: Average time course of licking (5 min bins) after injection of the middle dose (A) and the high dose (B) of DAMGO (dark grey) and saline (light grey) into the NAc core in the IA (left), CA (middle) and WA (right) groups. Stars indicate bins in which the number of licks was significantly different between DAMGO and saline injections.
C-H: The amount of COS consumed (C,D), number of lick bursts (E,F) and lick burst duration (G,H) are shown for the first quarter of the session (when most of the licking takes place; left) and the last 3 quarter of the session (right) for the IA (black), WA (white) and CA (grey) groups. Symbols in C-H show the results of post-hoc tests:
*: significant difference from the WA group (p < 0.05).
$, $$, $$$: significant difference from the CA group (p < 0.05, 0.01, 0.001).
#, #, ###: significant difference from control injection (p < 0.05, 0.01, 0.001); + trend to significance.

