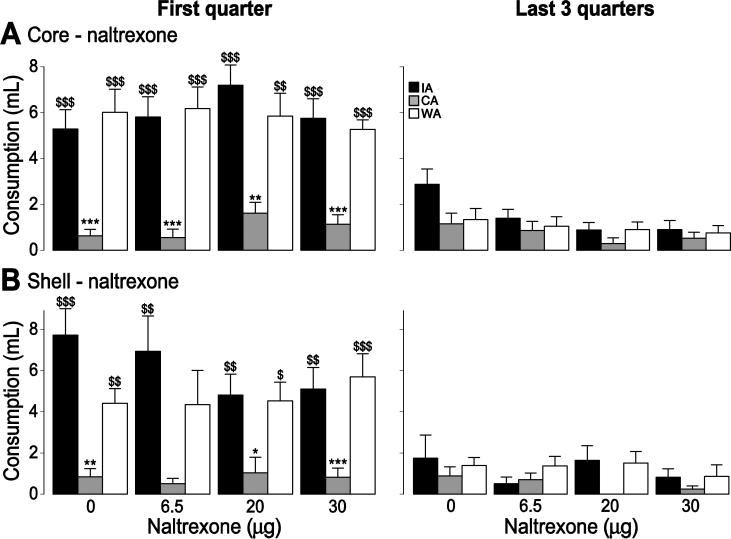
Figure 5. Effect of naltrexone o n COS consumption.
The effect of naltrexone injection in the core (A) and the shell (B) on COS consumption during the first quarter of the session (left) and the last 3 quarters of the session (right) for the IA (black), WA (white) and CA (grey) groups.
*, **, ***: significant difference from the WA group (p < 0.05, 0.01, 0.001).
$, $$, $$$: significant difference from the CA group (p < 0.05, 0.01, 0.001).

