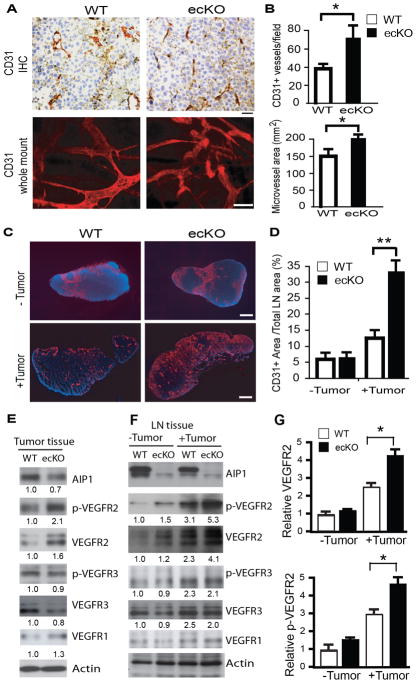
Figure 3. Tumor angiogenesis is increased in AIP1-ecKO mice.
Mouse breast cancer cells (1×10⁶) were injected orthotopically into the fourth mammary gland of WT and AIP1-ecKO mice, and tumor along with surrounding mammary tissue were harvested at 2 weeks. A–B. Tumor angiogenesis was determined by immunohistochemistry and whole-mount staining with anti-CD31, and intratumoral vessel density and vessel areas were quantified from 5 sections per tumor and n=10 mice for each strain, *, p<0.05. Scale bar: 50 μm. C–D. Tumor-induced angiogenesis in lymph nodes was determined by immunostaining with anti-CD31. Scale bar: 100 μm. CD31+ areas were quantified. n=10 mice per group. **, p<0.01. E–G. Phospho-VEGFR2 (pY1054/1059) and total VEGFR2, VEGFR3, AIP1 and β-actin proteins in tumor (E) and lymph node (F–G) were determined by immunoblotting with respective antibodies. Representative blots are shown from 1 of 4 mice for each strain with fold changes compared to WT-tumor are indicated below the blots. Further quantifications of VEGFR2 and p-VEGFR2 are shown in G, n=6 mice per group. **, p<0.01.

