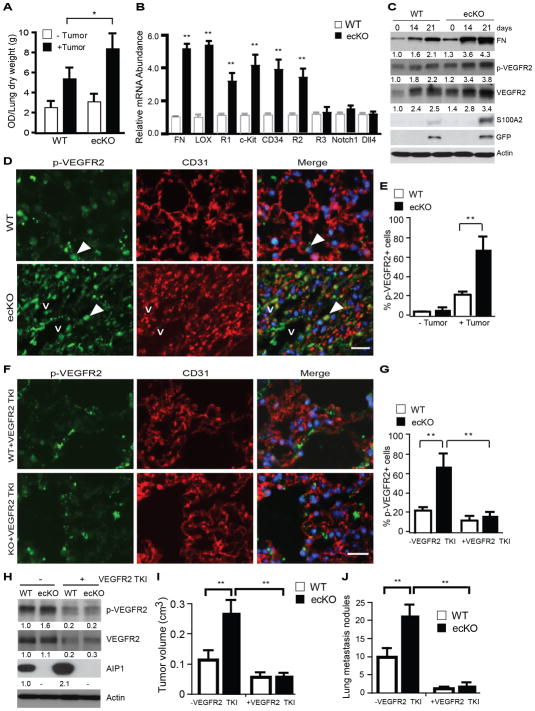
Figure 4. Tumor-induced pre-metastatic niche formation is augmented in AIP1-ecKO.
Mouse breast cancer cells (1×10⁶) were injected orthotopically into the fourth mammary gland of WT and AIP1-ecKO mice. A. Lung permeability was measured on day 10 post-implantation by Miles assay with Evan’s blue dye. The dye was extracted from the lung tissue and was measured at 630 nm. Data are presented as OD/lung dry weight (g) and are mean ± SEM from n=3 for each strain. *, p<0.05. B. Lung tissues were harvested at day 10 and gene expression of pre-metastasis niche markers were analyzed by qRT-PCR with normalization by GAPDH. Fold increases in AIP1-ecKO vs WT are shown. Data are mean ± SEM, n=6 for each strain. C. GFP-expressing mouse breast cancer cells were injected orthotopically into the fourth mammary gland of WT and AIP1-ecKO mice. Lung tissues were harvested at indicated times. Fibronectin, p-VEGFR2, VEGFR2, tumor markers S100A2 and GFP, and β-actin were determined by immunoblotting with respective antibodies. n=6 mice per group at each time point. Fold changes compared to the basal level in WT are shown. D–E. Recruitment of active VEGFR2+ cells to the lung tissue were increased in AIP1-ecKO mice but was diminished by VEGFR2-specific inhibitor. Some mice of WT and AIP1-KO mice with orthotopic breast tumor were treated by intravenous injection of VEGFR2 TKI (0.4 mM) every other day. p-VEGFR2 (pY1054/1059) and CD31 in the lung at day 14 were determined by immunostaining. v: vessel. Representative images are shown from 5 sections per tumor. Scale bar: 50 μm. Arrows indicate p-VEGFR2+ cells which are quantified in E as % of total cells. Data are mean ± SEM, n=6 per group. *, p<0.05. F–G. WT and AIP1-KO mice with orthotopic breast tumor were treated by intravenous injection of VEGFR2 TKI (0.4 mM) every other day. p-VEGFR2 (pY1054/1059) and CD31 in the lung at day 14 were determined by immunostaining. p-VEGFR2+ cells were quantified in G as % of total cells. Data are mean ± SEM, n=6 per group. *, p<0.05. H. Lung tissues were harvested at day 14, and p-VEGFR2 and total VEGFR2 were determined by immunoblotting. Fold changes are shown by taking WT control as 1.0. Representative blots are shown from 1 of 3 mice for each strain. I. Tumor volumes at 3 weeks were measured. J. Lung metastasis nodules at 3 weeks were quantified. Data are mean ± SEM, n=6 mice per group. *, p<0.05; **, p<0.01.

