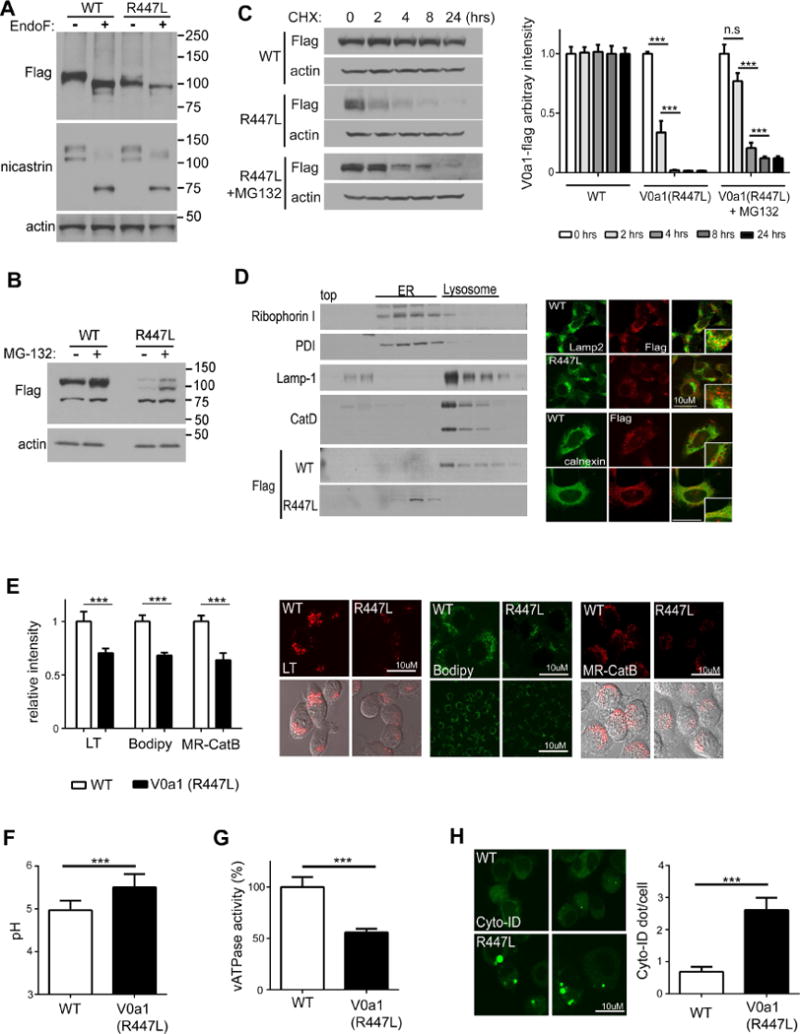
Figure 6. The mutant protein construct V0a1R447L-flag is not glycosylated and is degraded in N2a cells.

(A) Cell lysates were immunoblotted with anti-flag antibody followed by PNGase F treatment Nicastrin blots provided as a positive control for PNGase treatments (B) Cell lysates were immunoblotted with anti-flag antibody followed by proteasome inhibitor (MG-132) treatment for 24 hrs (C). Cell lysates were immunoblotted with anti-flag antibody followed by CHX treatment for the indicated time Cell lysates form V0a1R447L-flag were pre-incubated with MG-132 for 24 hrs then treated with CHX for the indicated time Levels of V0a1-flag were quantified Results were plotted as ratios normalized to the non-treated sample per each cell line (D) Immunoblot of V0a1-flag distribution in subcellular fractions of V0a1WT-flag and V0a1R447L-flag ER marker proteins (Ribophorin-I and PDI) primary localized infractions 5–11 and lysosomal marker proteins (LAMP-1 and mature CatD) mainly in fractions 13–17. Double-immunostaining showed strong colocalization of V0a1-flag and LAMP-2 in V0a1WT -flag cells, whereas V0a1R447L-flag strongly colocalized with ER marker calnexin Scale bar 10 μm (E) Cells were incubated with LysoTracker for lysosomal acidification assay To access the in vivo lysosomal enzyme activity, cells were incubated with Bodipy-FL-pepstatin A and MR-CatB for CatD and CatB activity, respectively Scale bar 10 μm Intensity of signal was quantified (LT: n=60, Bodipy: n=50, MR-CatB: n=55). Results were plotted as ratios normalized to V0a1WT-flag (F) Lysosomal pH values were measured ratiometrically using LysoSensor Yellow/Blue-dextran (n=10, at least 6 × 10³ cells/n). (G) v-ATPase activity was reduced in V0a1R447Lcells (H) Autophagosomes were immunolabeled with Cyto-ID autophagy detection kit Results were plotted as mean of AV (Cyto-ID) puncta number per cells (n=80). Scale bar 10 μm * denotes p<0.05, ** denotes p<0.001, *** denotes p<0.0001. Error bars: ±S.E.M
