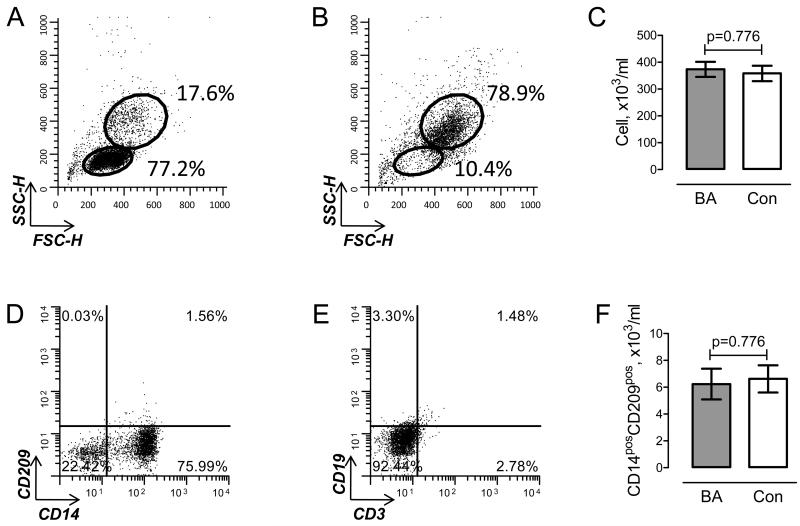
Figure 1. Isolation of human peripheral blood monocytes.
Representative flow cutometric dot plots demonstrating SSC-H/FSC-H scatters following Fycoll-Hypaque (A) and Percoll (B) gradient. The upper gate corresponds to “monocyte” and lower gate to “lymphocyte” cell populations. C. Number of monocytes, calculated from percentage of cells in “monocyte” gate and the total number of cells, in patients with bronchial asthma (BA, grey bar) and controls (open bar). D, E. Representative dot plots showing cell surface expression of CD14 and CD209 (D), and CD3 and CD19 (E) in subpopulation of isolated monocytes. F. Number of CD14posCD209pos monocytes in BA and control. P values are indicated; unpaired t test.

