Figure 2.
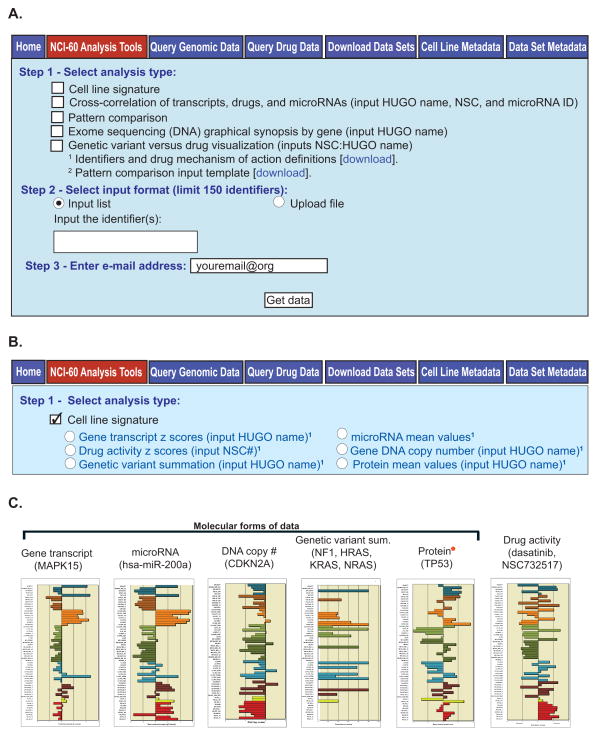
The “NCI-60 Analysis Tools” and “Cell line signature”. A. The “NCI-60 Analysis Tools”. To access this tool, click on the “NCI-60 Analysis Tools” tab (with red fill). In “Step 1”, the type of analysis to be done is selected from the options shown. The identifiers used in these tools are available from the “Identifiers and drug mechanism of action definitions” download. In “Step 2”, the user selects whether to input the identifiers as a list or as an uploaded file, and the identifiers are entered or uploaded. In “Step 3”, the user enters their e-mail address, and clicks “Get data”. B. The “Cell line signature” tool. To access this tool, click on the “NCI-60 Analysis Tools” tab, followed by the “Cell line signature” check box. Select from the six forms of signatures using the radio buttons. Identifier input and data receipt is done as in Fig. 2A. C. Bar graph examples for the five forms of molecular data, plus the compound activities available currently. In all bar-plot outputs, the x-axis indicates higher levels to the right, and lower levels to the left. The y-axis is the 60 cell lines, organized by tissue of origin. The red star next to “Protein” indicates it is a new output (introduced here).

