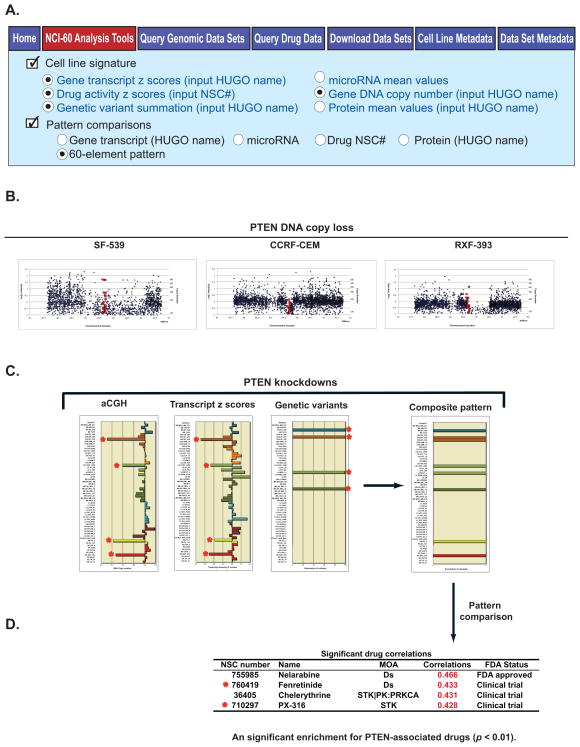
Figure 5.
A composite analysis of PTEN knockdown and its link to pharmacology. A. All data used in this analysis is from the “Cell line signature” and “Pattern comparisons” tools. Access, identifier input, and data receipt is as described for Fig. 2 and Supplementary Fig. S1C and D. Data from the four indicated signatures “Gene transcript z scores”, “Gene DNA copy number”, “Genetic variant summation”, and “Drug activity z scores” were selected one at a time, using a “60 element pattern” input. B. Examples of cell lines with DNA copy number loss for PTEN, taken from the “Gene DNA copy number” tool (“Graphical Output” worksheet). The x-axis is the chromosomal location. The y-axis is dual labeled for both log2 intensity of the probes, and estimated DNA copy number. The blue points are the flanking probe intensities. The red points are the probe intensities that fall within the gene. C. Three molecular indications of PTEN knockdown. DNA loss as measured by aCGH occurs for four cell lines. For the bar graph, the x-axis indicates the DNA copy number, and the y-axis indicates the cell lines. RNA transcript expression is down-regulated in four cell lines. For the bar graphs, the x-axis is relative expression as indicated by z score. The y-axis is the cell lines. Deactivating mutations occur in four cell lines. For the bar graph, the colored bars indicate deactivating mutations, and the y-axis indicates the cell lines. In all three of these bar plots, the red stars indicate those cell lines with indication of PTEN knockdown. The composite (knockdown) pattern, derived from the three forms of molecular data, indicate knockdown occurs in eight cell lines. For this bar graph, the colored bars indicate PTEN knockdown, and the y-axis indicates the cell lines. The bar graphs for “Genetic variants”, and in the “Composite pattern” were generated to illustrate the point, and were not generated directly by CellMiner. D. Input of the composite pattern from Fig. 5C to “Pattern comparisons” identifies four FDA-approved or clinical trial drugs with significant correlation. MOA is mechanism of action. The red stars indicate that two of these have prior connection to PTEN, either through literature or pathway.

