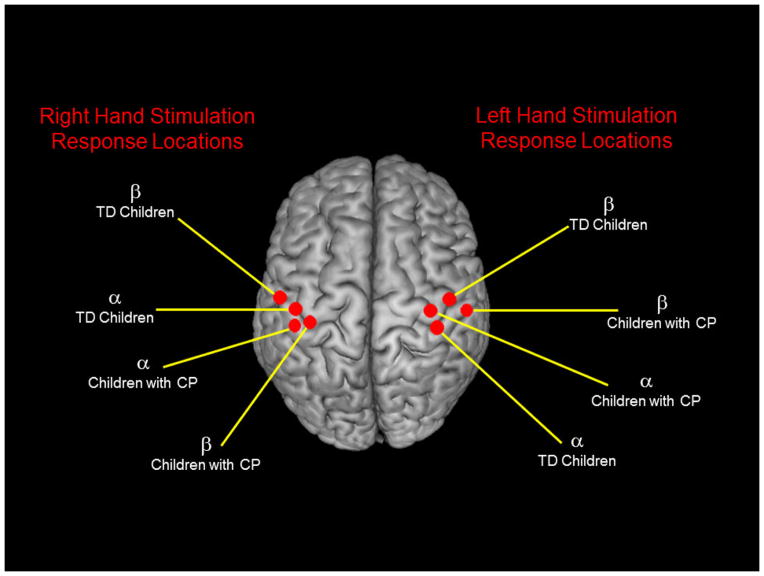
Figure 2.
Centroids of the group-mean beamformer images for each frequency bin (alpha-theta/beta), stimulated hand (left/right), and group (cerebral palsy/typically-developing). The amplitude of the peak voxel was extracted from each centroid of the alpha-theta and beta responses for the typically developing (TD) children and children with cerebral palsy (CP) for the respective hand that was stimulated. All statistics were conducted using these peak voxel amplitude values. For this experiment, the side of the body with the greatest impairment was stimulated for the children with CP, while the non-dominate hand was stimulated for the TD children.

