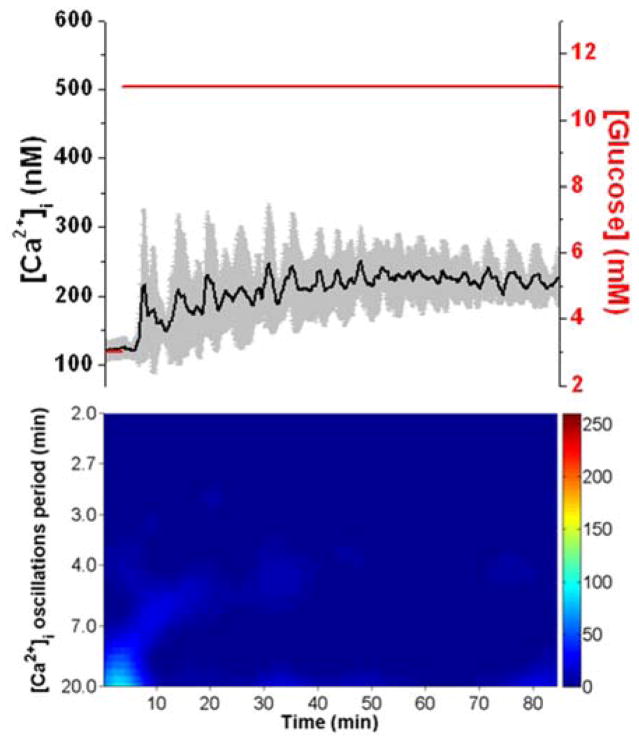
Fig. 3. Response to constant glucose level.
The top shows the average (black line) and ± 1 SD of the [Ca2+]i for 7 islets exposed to a constant glucose level (red) throughout the experiment. The spectrogram of the average [Ca2+]i is shown below and does not show any major frequency component. The scale of the spectrogram is the same as that in Fig. 2.

