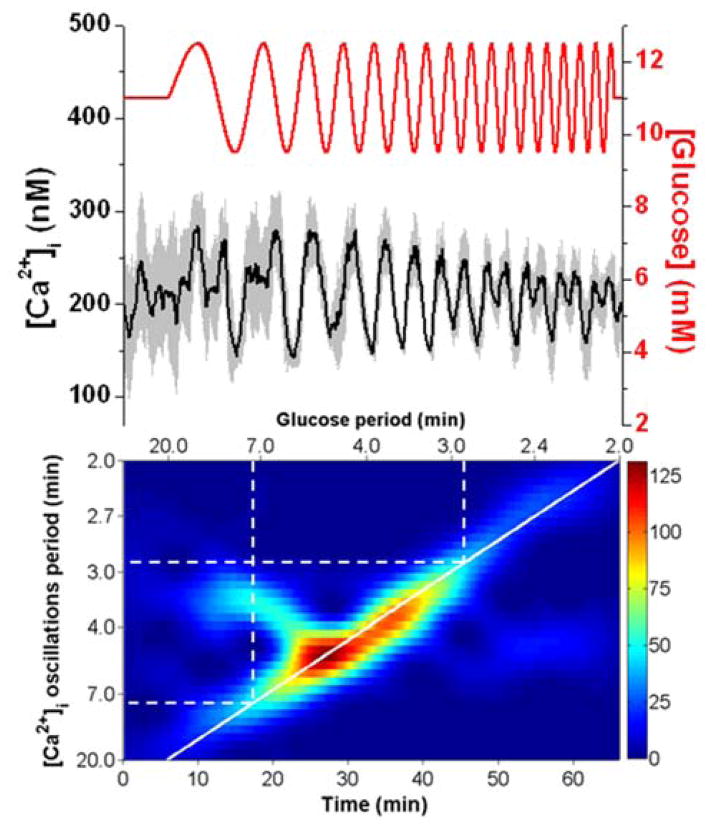
Fig. 5. Entrainment of islets using a chirped glucose waveform at 1.5 mM amplitude.
The average ± 1 SD [Ca2+]i from 6 islets is shown at the top of the figure. The data is shown starting with a glucose concentration of 11 mM for 6 min followed by a 60 min chirped wave. Similar to Fig. 2, the period of the waveform was swept from 20 - 2 min, but a 1.5 mM amplitude was used. The islets were entrained 1:1 between 7.2 and 2.9 min (dashed white lines).

