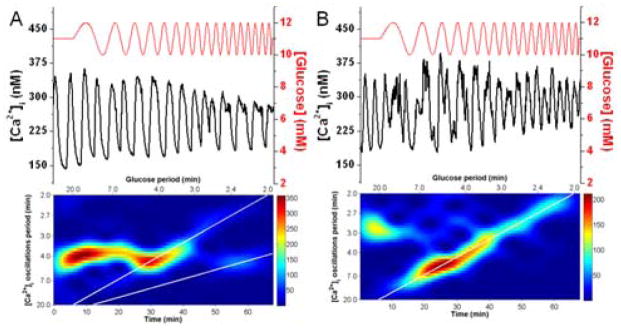
Fig. 7. Single islet entrainment data.

Two [Ca2+]i traces and their corresponding spectrograms from single islets are shown where the glucose period was swept from 20 - 2 min at a 1 mM amplitude. In (A) the islet had a Tn ~4 min and was entrained 1:1 from 27 - 45 min as seen by the [Ca2+]i oscillation period following the upper white line. The lower white line corresponds to 2:1 entrainment and the islet follows this line from 55 – 62 min. The spectrogram in (B) shows that the islet had a Tn ~3 min and upon application of the chirped wave, followed the 1:1 line from 13 – 65 min, corresponding to glucose periods of 9.8 - 2.0 min.
