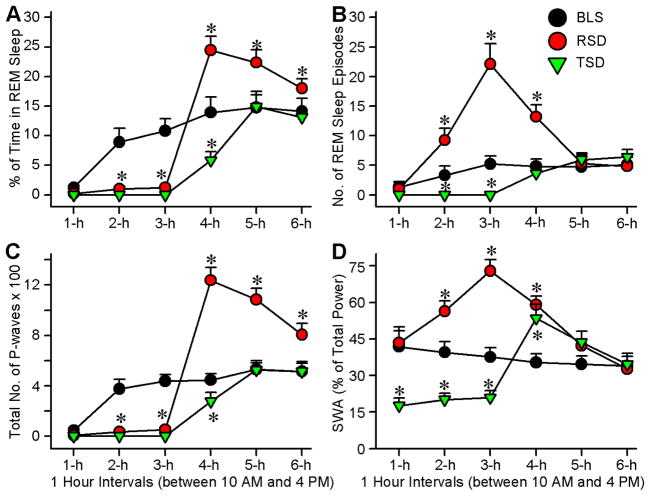
Figure 2.
Effects of REM sleep and total sleep deprivation on REM sleep and cortical slow-wave activity (SWA). A, Percentage of time spent (mean ± SE) in REM sleep during consecutive 1 h intervals across 6 h recording session. Note that compared with the BLS group, the RSD and TSD groups of rats spent little or to time in REM sleep during the first 3 h. Also note that during the recovery sleep period, RSD group, but not the TSD group, spent significantly more time in REM sleep. B, Number of REM sleep episodes (mean ± SE) during consecutive 1 h intervals across 6 h recording session. Note that the numbers of REM sleep episodes during the second and third hours are significantly higher in the RSD than in the BLS group. C, Number of P-waves (mean ± SE) during consecutive 1 h intervals across 6 h recording session. Note that during the first 3 hours, both the RSD and TSD groups exhibited almost no P-waves and then during the recovery sleep period P-waves are more only in the RSD animals. D, SWA (mean ± SE; expressed as the percentage of total power) during consecutive 1 h intervals across 6 h recording session. In the RSD group SWA increased with increased duration of RSD. Also note that in the TSD group SWA decreased during TSD and increased during the first hour of recovery sleep.

