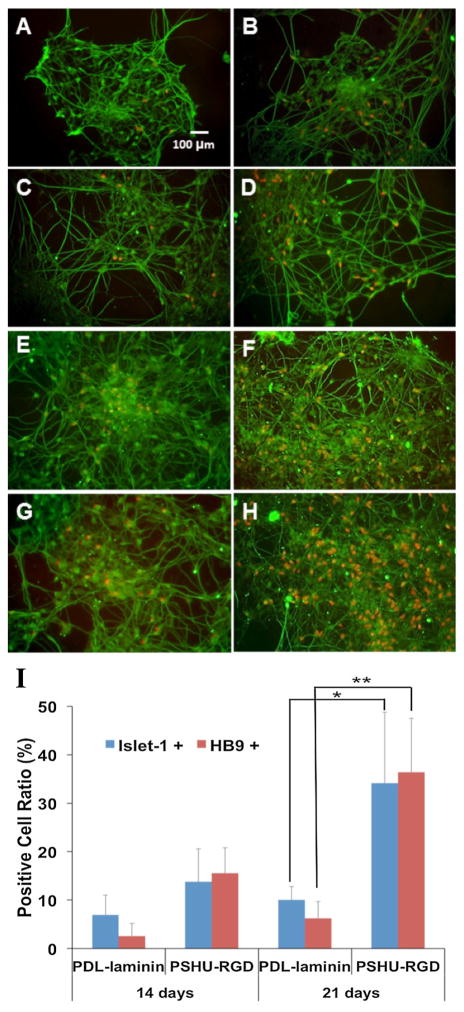
Figure 4.
Fluorescent microscopy images of hNSCs cultured on PDL-Laminin (A–D) and PSHU-RGD (E–H). After culture for 14 days (A,C,E,G) and 21 days (B,D,F,H), cells were stained with HB9+ and βIII-tubulin (A,B,E,F), and Isl1+ and βIII-tubulin (C,D,G,H). Red dots indicate HB9+ and Isl1+ cells. Quantitative analysis comparing the ratio of cells expressing Isl1 and HB9 at 14- and 21-day cultures. * and ** corresopond to p<0.001 and p<0.0001 respectively (I).

