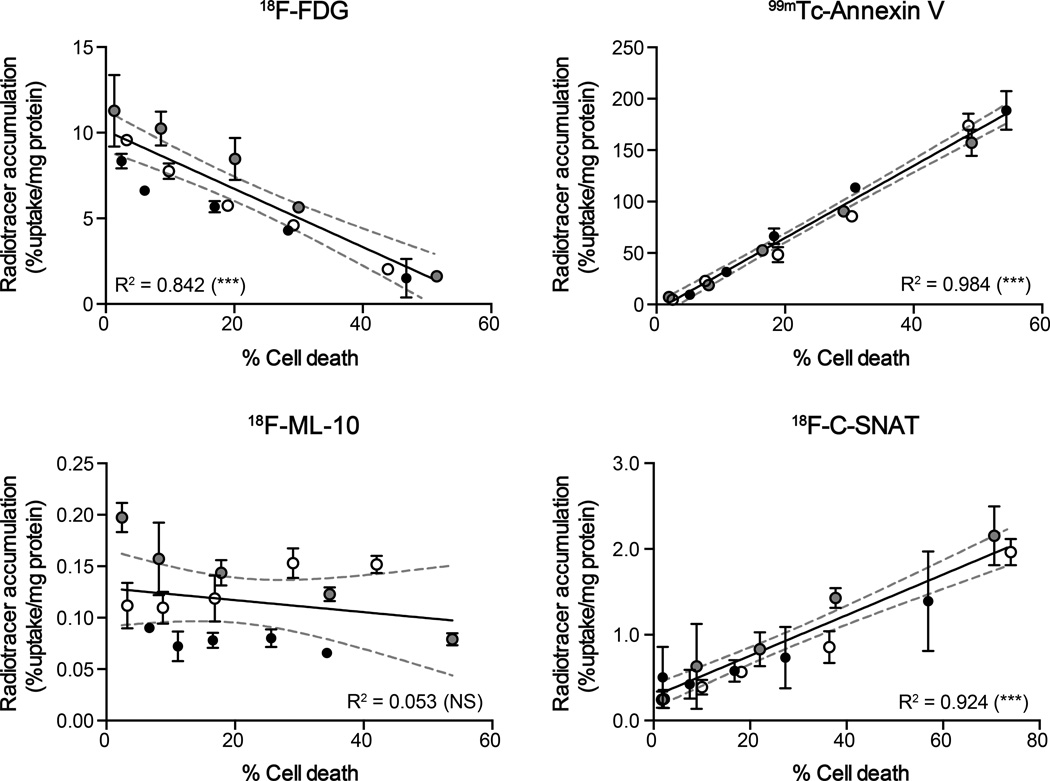
FIGURE 3.
Correlation between therapy-induced cell death and radiotracer accumulation in cells. Flow cytometic quantitation of cell death was compared to cell-associated radioactivity for 18F-FDG, 99mTc-HYNIC-Annexin V, 18F-ML-10 and 18F-C-SNAT in cell mixtures. Lines of linear regression and 95% confidence levels (broken gray lines) are shown. Mean ± SD (n = 3 independent experiments). Experiments performed on separate days are represented by either gray, open, or filled circles. *** P < 0.001; NS, not significant.

