FIGURE 4.
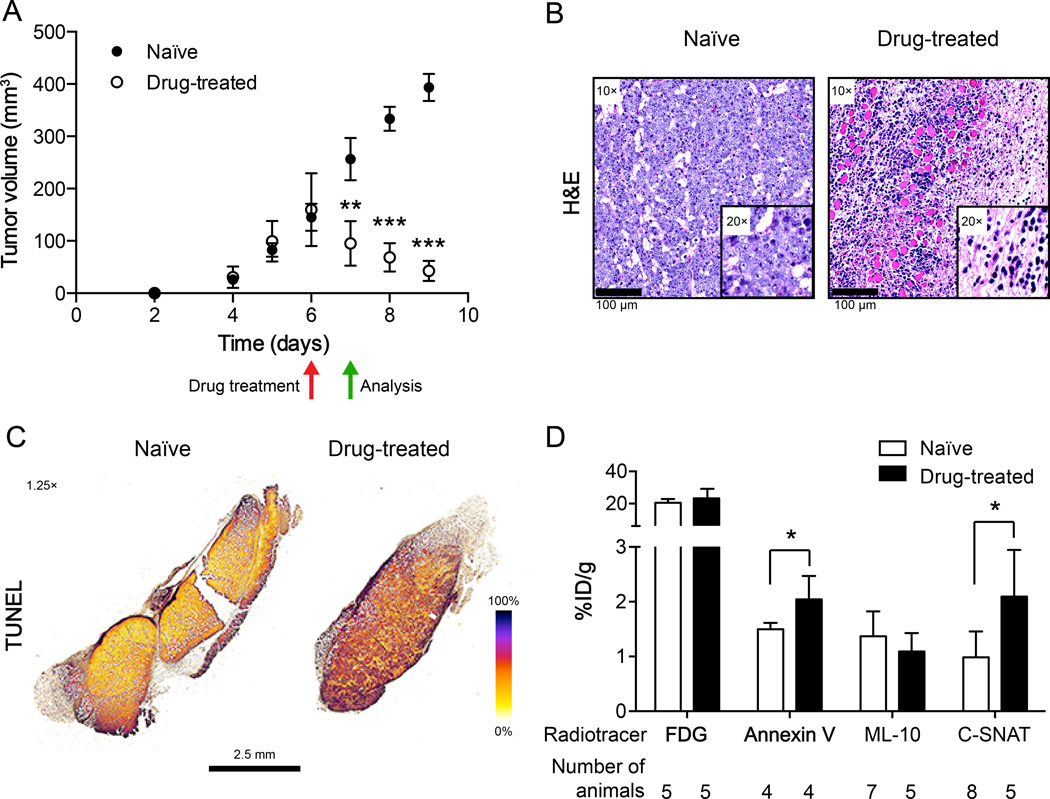
Characterization of therapy response and correlation to radiotracer accumulation in tumors. (A) Caliper measurements of EL-4 tumor volumes in naïve and drug-treated mice. Measurements were recorded as a function of time post cell implantation, with mice treated on day 6 (red arrow). All subsequent analysis was made on day 7, 24h post therapy (green arrow). Data represents mean ± SEM (n = 7–8 mice/group). (B) H&E staining of naïve and drug-treated histological tumor sections. Tumor sections were scanned by a whole-slide scanner, with representative regions of interest selected at 10× and 20× magnification (insert), indicating loss of cellularity and immune cell infiltration following treatment (day 7, 24h post drug). Scale bar = 100 µm. (C) DNA fragmentation (colorimetric TUNEL assay) detection in naïve and drug-treated whole tumor sections. Representative false-color sections are shown, acquired at 1.25× magnification (scale bar = 2.5 mm). (D) Radiotracer accumulation in drug-treated and naïve tumors. Radioactivity was measured by γ-counting of excised tumors 90 min post radiotracer administration. The values are the mean value ± SD of at least 4 mice (number of mice shown on graph).

