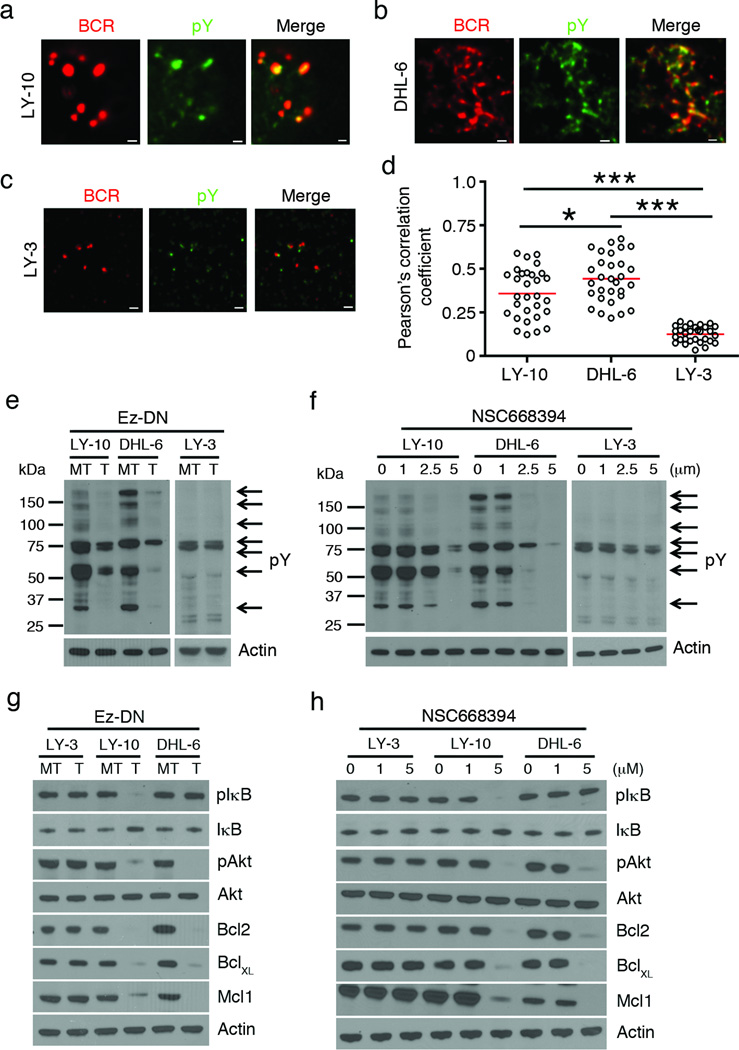
Figure 6. ERM inhibition impairs proximal and distal signaling in DLBCL cells.
BCRs (red) were stained on OCI-LY-10 (a) SU-DHL-6 (b) and OCI-LY-3 (c) cells, followed by staining of phosphotyrosine (pY; green), and imaging by TIRF microscopy. (d) Pearson’s co-localization coefficients are plotted for the indicated cell lines. Each dot represents an individual cell and horizontal lines indicate the mean. Mean ± SEM is shown (*P < 0.05; ***P < 0.001) for the indicated comparisons. Representative data from two independent experiments are shown, and ~25 cells were imaged per experiment. Indicated DLBCL cell lines were mock-transfected (MT) or transfected with Ez-DN (T) for 24 h (e), or treated with DMSO or indicated concentrations of NSC668394 for 24 h (f), and cell lysates were probed with antibodies to pY and actin. Indicated DLBCL cell lines were mock-transfected (MT) or transfected with Ez-DN (T) (g), or treated with DMSO or indicated concentrations of NSC668394 (h), and after 24 h the cell lysates were probed with antibodies to pIκB, IκB, pAkt, Akt, Bcl2, BclXL, Mcl1 and actin. Representative blots from three independent experiments are shown for e-h.

