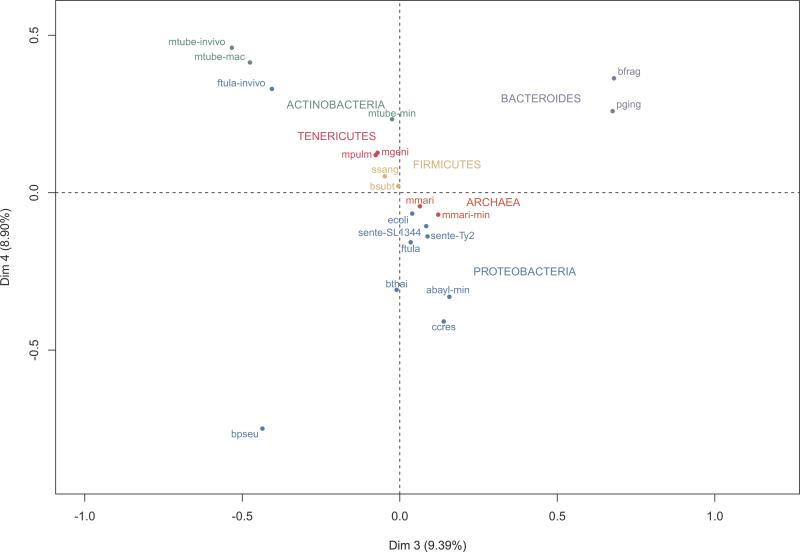
Figure 4. Multiple Correspondence Analysis (MCA) of the presence/absence of essential genes in NOGs.
MCA analysis of essential gene sets based on the presence/absence profiles of each mapped NOG. The first two dimensions obtained in MCA were dominated by one or two samples and therefore, are not very useful for separation purposes. Dimensions 3 and 4 allowed an evolutionarily coherent clustering, while still accounting for a significant amount of variance. For abbreviations of in vitro experiments refer to Figure 1. For in vivo experiments: ftula-invivo (F. tularensis novicida U112, in vivo); mtube-invivo (Mycobacterium tuberculosis H37Rv, in vivo); and mtube-mac (Mycobacterium tuberculosis H37Rv, macrophages). For color codes, refer to Figure 3.

